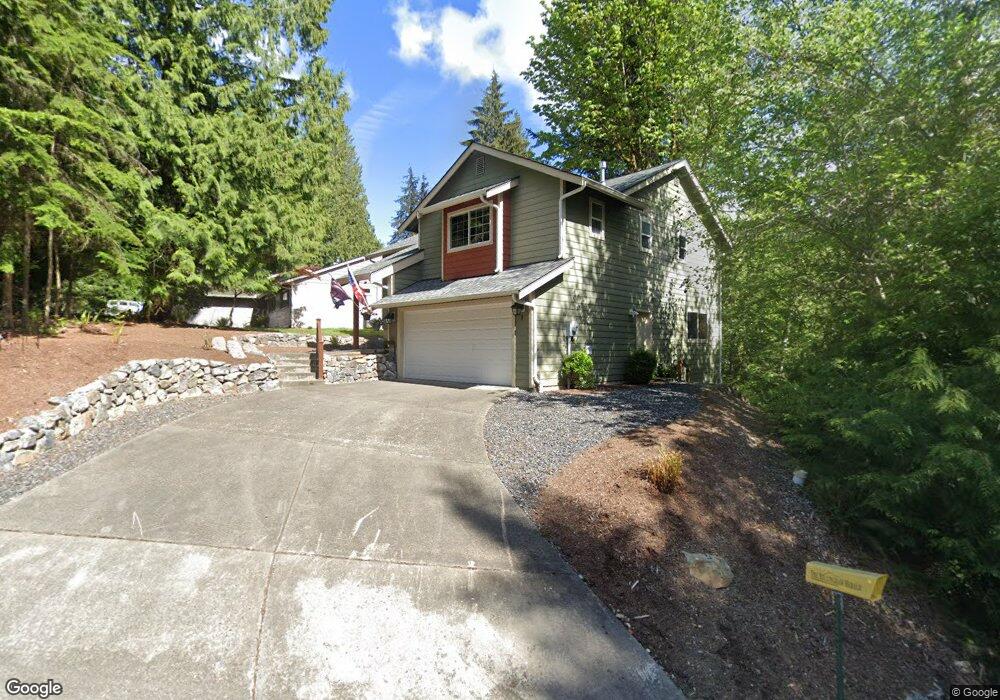
1 High Cliff Ln Bellingham, WA 98229
Estimated Value: $562,000 - $620,000
4
Beds
3
Baths
1,948
Sq Ft
$302/Sq Ft
Est. Value
About This Home
This home is located at 1 High Cliff Ln, Bellingham, WA 98229 and is currently estimated at $588,227, approximately $301 per square foot. 1 High Cliff Ln is a home located in Whatcom County with nearby schools including Geneva Elementary School, Kulshan Middle School, and Bellingham High School.
Ownership History
Date
Name
Owned For
Owner Type
Purchase Details
Closed on
Feb 3, 2004
Sold by
J Morris Properties Llc
Bought by
Banton Susan E
Current Estimated Value
Home Financials for this Owner
Home Financials are based on the most recent Mortgage that was taken out on this home.
Original Mortgage
$164,700
Outstanding Balance
$68,695
Interest Rate
4.25%
Mortgage Type
Purchase Money Mortgage
Estimated Equity
$519,532
Purchase Details
Closed on
Mar 6, 2003
Sold by
Sanwick James and Sanwick Brenda
Bought by
J Morris Properties Llc
Home Financials for this Owner
Home Financials are based on the most recent Mortgage that was taken out on this home.
Original Mortgage
$125,000
Interest Rate
5.83%
Create a Home Valuation Report for This Property
The Home Valuation Report is an in-depth analysis detailing your home's value as well as a comparison with similar homes in the area
Home Values in the Area
Average Home Value in this Area
Purchase History
| Date | Buyer | Sale Price | Title Company |
|---|---|---|---|
| Banton Susan E | $176,981 | Stewart Title Company | |
| J Morris Properties Llc | -- | Whatcom Land Title |
Source: Public Records
Mortgage History
| Date | Status | Borrower | Loan Amount |
|---|---|---|---|
| Open | Banton Susan E | $164,700 | |
| Previous Owner | J Morris Properties Llc | $125,000 |
Source: Public Records
Tax History Compared to Growth
Tax History
| Year | Tax Paid | Tax Assessment Tax Assessment Total Assessment is a certain percentage of the fair market value that is determined by local assessors to be the total taxable value of land and additions on the property. | Land | Improvement |
|---|---|---|---|---|
| 2024 | $4,670 | $538,139 | $134,920 | $403,219 |
| 2023 | $4,670 | $541,425 | $135,744 | $405,681 |
| 2022 | $3,667 | $466,759 | $117,024 | $349,735 |
| 2021 | $3,518 | $338,231 | $84,800 | $253,431 |
| 2020 | $3,542 | $319,086 | $80,000 | $239,086 |
| 2019 | $3,245 | $314,903 | $69,044 | $245,859 |
| 2018 | $3,255 | $295,681 | $64,800 | $230,881 |
| 2017 | $2,747 | $252,683 | $55,350 | $197,333 |
| 2016 | $2,459 | $222,308 | $48,600 | $173,708 |
| 2015 | $2,462 | $208,455 | $46,323 | $162,132 |
| 2014 | -- | $202,501 | $45,000 | $157,501 |
| 2013 | -- | $202,915 | $42,600 | $160,315 |
Source: Public Records
Map
Nearby Homes
- 14 Black Bear Ct Unit A
- 80 Polo Park Dr
- 3 Huckleberry Ct Unit B
- 39 Stable Ln
- 203 Sudden Valley Dr
- 13 Westbrook Ct
- 196 Sudden Valley Dr
- 40 Morning Glory Dr
- 137 Sudden Valley Dr
- 214 Polo Park Dr
- 209 Harbor View Dr
- 26 Jasper Ridge Ln
- 4 Twin Flower Cir
- 16 Sandalwood Cir
- 34 Green Hill Rd
- 8 Twin Flower Cir
- 130 Harbor View Dr
- 8 Morning Glory Dr
- 20 Hillside Place
- 15 A N Summit Dr
- 4 High Cliff Ln
- 6 High Cliff Ln
- 2 High Cliff Ln
- 5 High Cliff Ln
- 7 High Cliff Ln
- 11 Black Bear Ct Unit B
- 247 Sudden Valley Dr Unit A
- 247a Sudden Valley Dr
- 1 Black Bear Ct
- 11 High Cliff Ln
- 5 Black Bear Ct
- 250 Sudden Valley Dr
- 3 Black Bear Ct
- 12 Glacier Ridge Dr
- 183 Sudden Valley Dr
- 15 High Cliff Ln
- 10 Glacier Ridge Dr
- 14 Granite Cir
- 18 Granite Cir
- 7 Black Bear Ct