Estimated Value: $378,000 - $448,000
3
Beds
2
Baths
1,542
Sq Ft
$269/Sq Ft
Est. Value
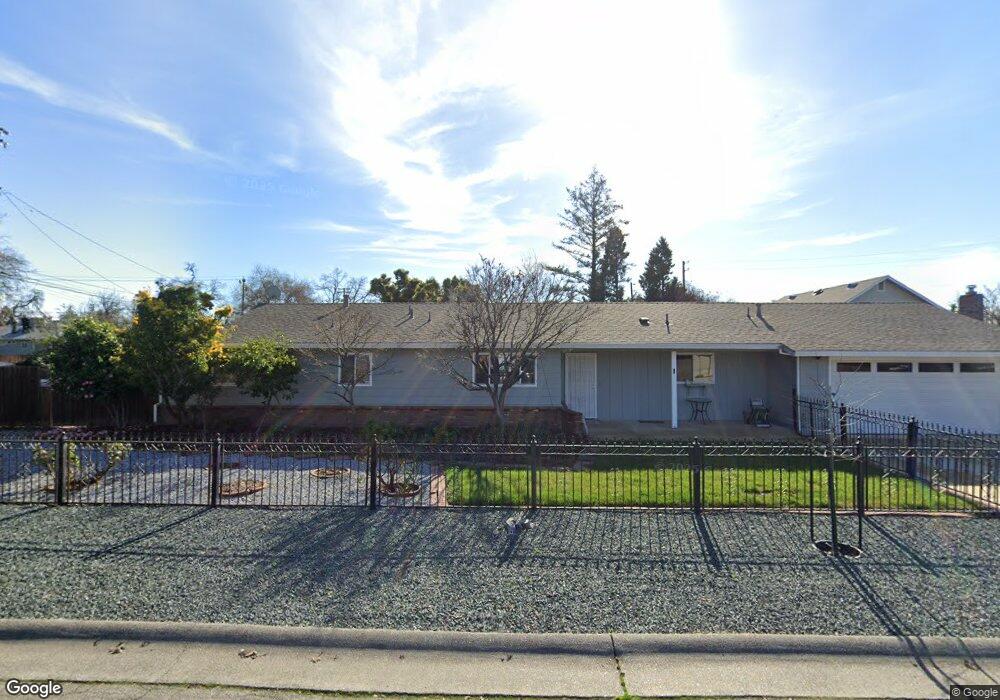
About This Home
This home is located at 1 Highland Cir, Chico, CA 95926 and is currently estimated at $415,390, approximately $269 per square foot. 1 Highland Cir is a home located in Butte County with nearby schools including Neal Dow Elementary School, Bidwell Junior High School, and Pleasant Valley High School.
Ownership History
Date
Name
Owned For
Owner Type
Purchase Details
Closed on
Jun 26, 2017
Sold by
De Hernandez Ascebcio and De Jesus Lopez Teresa
Bought by
Jesus Hernandez J and Jesus Lopez Teresa De
Current Estimated Value
Purchase Details
Closed on
Aug 26, 2011
Sold by
Hernandez J Ascencion and Lopez Teresa De Jesus
Bought by
Hernandez J Ascencion and Lopez Teresa De Jesus
Purchase Details
Closed on
Jul 1, 2011
Sold by
Gray James L and The William Harold & Mildred E
Bought by
Askea Michael Vaughn and Askea William Craig
Purchase Details
Closed on
Jul 3, 2006
Sold by
Askea Mildred Elaine and The William Harold Askea & Mil
Bought by
Askea Mildred Elaine and The William Harold Askea & Mildred Elain
Purchase Details
Closed on
Nov 27, 2000
Sold by
Askea William H and Askea Mildred E
Bought by
Askea William Harold and Askea Mildred Elaine
Create a Home Valuation Report for This Property
The Home Valuation Report is an in-depth analysis detailing your home's value as well as a comparison with similar homes in the area
Purchase History
We collect this data history from publicly available records. To have your information removed, we recommend requesting removal directly through your county’s website.
| Date | Buyer | Sale Price | Title Company |
|---|---|---|---|
| Jesus Hernandez J | -- | None Available | |
| Hernandez J Ascencion | -- | Mid Valley Title & Escrow Co | |
| Hernandez J Ascencion | $227,000 | Mid Valley Title & Escrow Co | |
| Askea Michael Vaughn | -- | None Available | |
| Askea Mildred Elaine | -- | None Available | |
| Askea William Harold | -- | -- |
Source: Public Records
Tax History
| Year | Tax Paid | Tax Assessment Tax Assessment Total Assessment is a certain percentage of the fair market value that is determined by local assessors to be the total taxable value of land and additions on the property. | Land | Improvement |
|---|---|---|---|---|
| 2025 | $3,096 | $285,110 | $123,087 | $162,023 |
| 2024 | $3,096 | $279,521 | $120,674 | $158,847 |
| 2023 | $3,060 | $274,041 | $118,308 | $155,733 |
| 2022 | $3,010 | $268,669 | $115,989 | $152,680 |
| 2021 | $2,954 | $263,402 | $113,715 | $149,687 |
| 2020 | $2,945 | $260,702 | $112,549 | $148,153 |
| 2019 | $2,892 | $255,592 | $110,343 | $145,249 |
| 2018 | $2,839 | $250,581 | $108,180 | $142,401 |
| 2017 | $2,781 | $245,668 | $106,059 | $139,609 |
| 2016 | $2,539 | $240,852 | $103,980 | $136,872 |
| 2015 | $2,539 | $237,236 | $102,419 | $134,817 |
| 2014 | $2,490 | $232,590 | $100,413 | $132,177 |
Source: Public Records
Map
Nearby Homes
- 1094 Manzanita Ave
- 1165 Ceres Manor Ct
- 1609 Plumas Way
- 1191 Bonair Rd
- 78 Ceres Cir
- 0 Us-99
- 15521 Us-99
- 2 Canterbury Cir
- 12 Jean Ln
- 1287 Howard Dr
- 1415 Sheridan Ave Unit 22
- 1415 Sheridan Ave
- 1179 East Ave
- 7 Jenny Way
- 1125 Sheridan Ave Unit 62
- 1125 Sheridan Ave Unit 37
- 2530 Ceres Ave
- 996 E 1st Ave
- 2560 North Ave
- 4 Harrier Ln
- 2139 Ceres Ave
- 3 Highland Cir
- 2 Highland Cir
- 2130 Ceres Ave
- 4 Highland Cir
- 1152 Manzanita Ave
- 25 Highland Cir
- 2140 Ceres Ave
- 5 Highland Cir
- 1092 Manzanita Ave
- 6 Highland Cir
- 23 Highland Cir
- 2149 Ceres Ave
- 1156 Manzanita Ave
- 2142 Ceres Ave
- 1088 Manzanita Ave
- 201 Haven Ln
- 199 Haven Ln
- 2151 Ceres Ave
- 8 Highland Cir
Your Personal Tour Guide
Ask me questions while you tour the home.