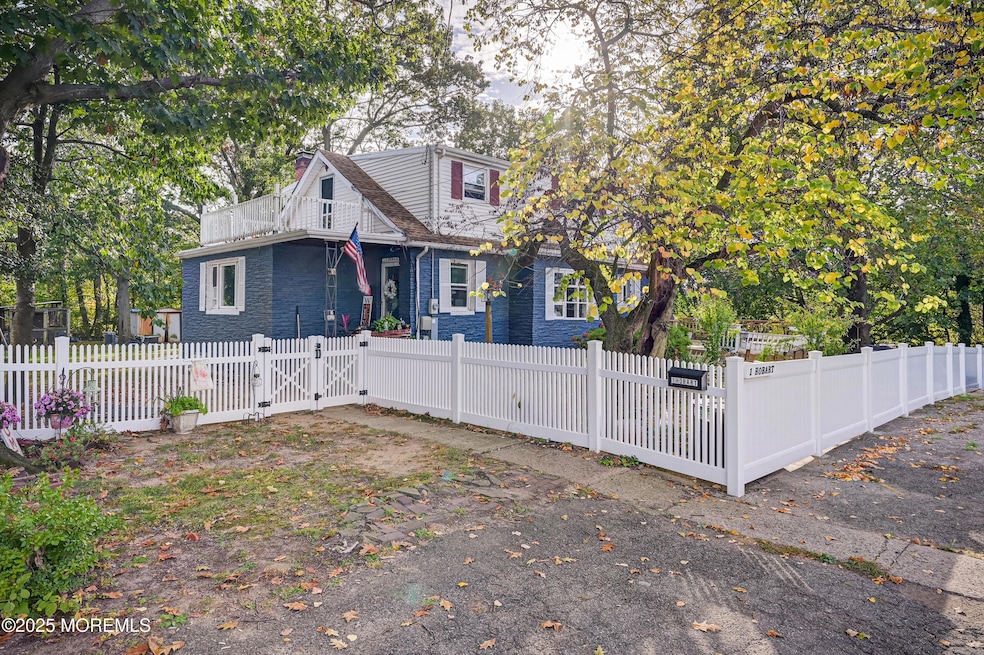
1 Hobart St Keyport, NJ 07735
Estimated payment $3,318/month
Highlights
- Above Ground Pool
- Deck
- Main Floor Bedroom
- Custom Home
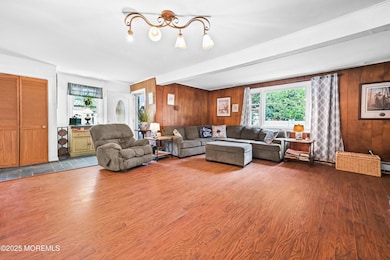
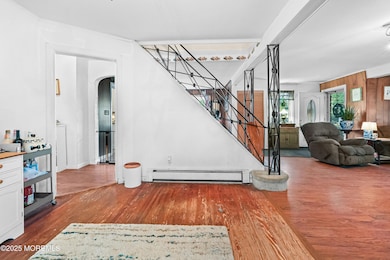
- Wood Flooring
- Workshop
About This Home
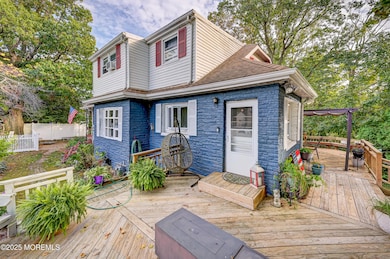
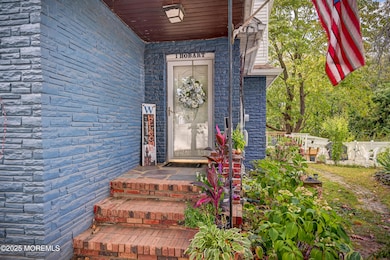
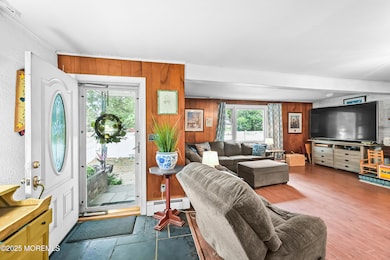
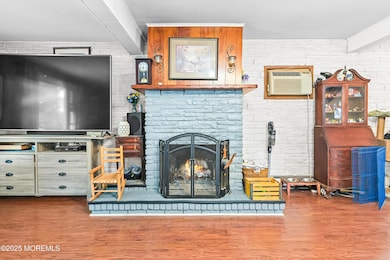
Welcome to 1 Hobart Street — Peacefully tucked away in a quiet corner of Keyport, where timeless charm meets everyday comfort. Inside, a warm living room with wood accents and a brick fireplace flows into a bright dining area and renovated kitchen featuring white shaker cabinets, quartz counters, a farmhouse sink, stainless-steel appliances, and breakfast seating. With 5 versatile bedrooms, 2 updated baths, and a finished basement with bar, gym, and entertainment area, this home offers flexibility for any lifestyle. Outside, enjoy a fully fenced yard with a multi-tier deck surrounded by mature trees, perfect for relaxing or entertaining. All minutes from Keyport's waterfront, restaurants, and shops
Listing Agent
VRI Homes Brokerage Phone: 800-531-2885 License #1973231 Listed on: 10/15/2025
Home Details
Home Type
- Single Family
Est. Annual Taxes
- $8,371
Year Built
- Built in 1940
Lot Details
- 8,712 Sq Ft Lot
- Lot Dimensions are 62 x 140
- Cul-De-Sac
- Irregular Lot
Home Design
- Custom Home
- Colonial Architecture
- Brick Exterior Construction
- Shingle Roof
- Vinyl Siding
Interior Spaces
- 2,258 Sq Ft Home
- 3-Story Property
- Crown Molding
- Wood Burning Fireplace
- Bay Window
- Sliding Doors
Kitchen
- Eat-In Kitchen
- Breakfast Bar
- Stove
- Microwave
- Dishwasher
- Farmhouse Sink
Flooring
- Wood
- Laminate
Bedrooms and Bathrooms
- 5 Bedrooms
- Main Floor Bedroom
- 2 Full Bathrooms
- Primary Bathroom Bathtub Only
Laundry
- Dryer
- Washer
Finished Basement
- Heated Basement
- Walk-Out Basement
- Basement Fills Entire Space Under The House
- Workshop
Parking
- Driveway
- On-Street Parking
Pool
- Above Ground Pool
- Outdoor Pool
Outdoor Features
- Balcony
- Deck
- Exterior Lighting
- Shed
- Porch
Schools
- Central Elementary And Middle School
- Keyport High School
Utilities
- Air Conditioning
- Multiple cooling system units
- Heating System Uses Natural Gas
- Baseboard Heating
- Natural Gas Water Heater
Community Details
- No Home Owners Association
Listing and Financial Details
- Assessor Parcel Number 24-00011-0000-00001
Map
Home Values in the Area
Average Home Value in this Area
Tax History
| Year | Tax Paid | Tax Assessment Tax Assessment Total Assessment is a certain percentage of the fair market value that is determined by local assessors to be the total taxable value of land and additions on the property. | Land | Improvement |
|---|---|---|---|---|
| 2025 | $8,371 | $442,900 | $206,300 | $236,600 |
| 2024 | $8,253 | $404,400 | $179,400 | $225,000 |
| 2023 | $8,253 | $375,500 | $163,100 | $212,400 |
| 2022 | $4,556 | $326,400 | $141,800 | $184,600 |
| 2021 | $4,556 | $322,400 | $131,300 | $191,100 |
| 2020 | $7,843 | $308,400 | $126,600 | $181,800 |
| 2019 | $7,609 | $299,700 | $122,100 | $177,600 |
| 2018 | $7,613 | $292,800 | $126,600 | $166,200 |
| 2017 | $7,461 | $286,200 | $122,100 | $164,100 |
| 2016 | $7,328 | $283,500 | $122,100 | $161,400 |
| 2015 | $6,955 | $267,800 | $108,600 | $159,200 |
| 2014 | $6,649 | $258,500 | $86,100 | $172,400 |
Property History
| Date | Event | Price | List to Sale | Price per Sq Ft |
|---|---|---|---|---|
| 10/15/2025 10/15/25 | For Sale | $495,999 | -- | $220 / Sq Ft |
Purchase History
| Date | Type | Sale Price | Title Company |
|---|---|---|---|
| Deed | $142,000 | -- | |
| Deed | $113,150 | -- |
Mortgage History
| Date | Status | Loan Amount | Loan Type |
|---|---|---|---|
| Previous Owner | $110,000 | No Value Available | |
| Previous Owner | $90,000 | No Value Available |
Source: MOREMLS (Monmouth Ocean Regional REALTORS®)
MLS Number: 22531174
APN: 24-00011-0000-00001
Disclaimer: Certain information contained herein is derived from information provided by parties other than Homes.com. All information provided is deemed reliable, but is not guaranteed to be accurate and should be independently verified.
![]() IDX information is provided exclusively for personal, non-commercial use, and may not be used for any purpose other than to identify prospective properties consumers may be interested in purchasing.
IDX information is provided exclusively for personal, non-commercial use, and may not be used for any purpose other than to identify prospective properties consumers may be interested in purchasing.
Information is deemed reliable but not guaranteed.
- 52 Highway 35
- 194 Washington St
- 253 Broadway
- 279 Washington St
- 116 Therese Ave
- 324 Maple Place
- 127 Chingarora Ave
- 362 Broadway
- 22 Lower Main St
- 95 Broadway
- 8 Chingarora Ave
- 369 Riverdale Dr
- 557 Lloyd Rd Unit B
- 9 Monmouth Place
- 69 Maple Place
- 90 Saint Peters Place
- 23 Mathiasen Place
- 154 Lower Main St
- 14 Dolan Ave
- 716 Prospect Ave
- 164 W Front St Unit 2
- 45 Beers St
- 1000 Central Ave
- 144 Lower Main St
- 14-16 Kearney St Unit 14
- 54 Main St Unit 2
- 1101 Schindler Dr
- 159 Village Green Way
- 36 Center St
- 244 Raritan St
- 251 Atlantic St
- 400 Matawan Ave
- 91 Jackson St
- 811 Shore Concourse
- 171 Matawan Ave
- 2 Sutton Dr
- 145 Cliffwood Ave
- 118 Glassworks Blvd
- 123 Main St
- 418 Atlantic Ave
