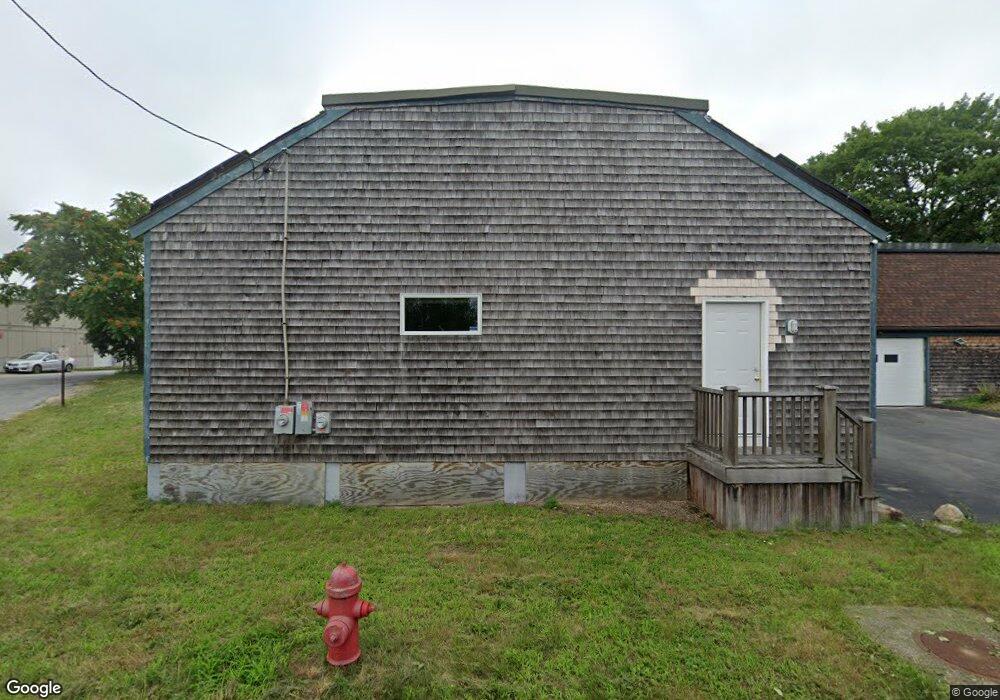
1 Hope St Acushnet, MA 02743
Estimated Value: $395,277
Studio
--
Bath
3,805
Sq Ft
$104/Sq Ft
Est. Value
About This Home
This home is located at 1 Hope St, Acushnet, MA 02743 and is currently estimated at $395,277, approximately $103 per square foot. 1 Hope St is a home located in Bristol County with nearby schools including Acushnet Elementary School, Albert F Ford Middle School, and Alma Del Mar Charter School.
Ownership History
Date
Name
Owned For
Owner Type
Purchase Details
Closed on
May 23, 2014
Sold by
Crovello David A and American First Fed Inc
Bought by
Alabama Properties Llc
Current Estimated Value
Purchase Details
Closed on
Apr 19, 2001
Sold by
Pittsley Jeannette T
Bought by
Crovello David A and Camire Philip R
Home Financials for this Owner
Home Financials are based on the most recent Mortgage that was taken out on this home.
Original Mortgage
$120,000
Interest Rate
6.9%
Mortgage Type
Commercial
Create a Home Valuation Report for This Property
The Home Valuation Report is an in-depth analysis detailing your home's value as well as a comparison with similar homes in the area
Home Values in the Area
Average Home Value in this Area
Purchase History
| Date | Buyer | Sale Price | Title Company |
|---|---|---|---|
| Alabama Properties Llc | $125,000 | -- | |
| Crovello David A | $65,000 | -- |
Source: Public Records
Mortgage History
| Date | Status | Borrower | Loan Amount |
|---|---|---|---|
| Previous Owner | Crovello David A | $178,000 | |
| Previous Owner | Crovello David A | $150,000 | |
| Previous Owner | Crovello David A | $50,000 | |
| Previous Owner | Crovello David A | $120,000 |
Source: Public Records
Tax History
| Year | Tax Paid | Tax Assessment Tax Assessment Total Assessment is a certain percentage of the fair market value that is determined by local assessors to be the total taxable value of land and additions on the property. | Land | Improvement |
|---|---|---|---|---|
| 2025 | $0 | $393,700 | $129,800 | $263,900 |
| 2024 | $5,520 | $366,300 | $122,200 | $244,100 |
| 2023 | $0 | $342,200 | $114,600 | $227,600 |
| 2022 | $5,520 | $318,100 | $106,900 | $211,200 |
| 2021 | $0 | $307,500 | $99,300 | $208,200 |
| 2020 | $4,743 | $307,500 | $99,300 | $208,200 |
| 2019 | $5,242 | $288,000 | $88,600 | $199,400 |
| 2018 | $4,475 | $284,900 | $85,500 | $199,400 |
| 2017 | $4,287 | $284,900 | $85,500 | $199,400 |
| 2016 | $5,212 | $280,200 | $84,000 | $196,200 |
| 2015 | $5,122 | $280,200 | $84,000 | $196,200 |
Source: Public Records
Map
Nearby Homes
Your Personal Tour Guide
Ask me questions while you tour the home.