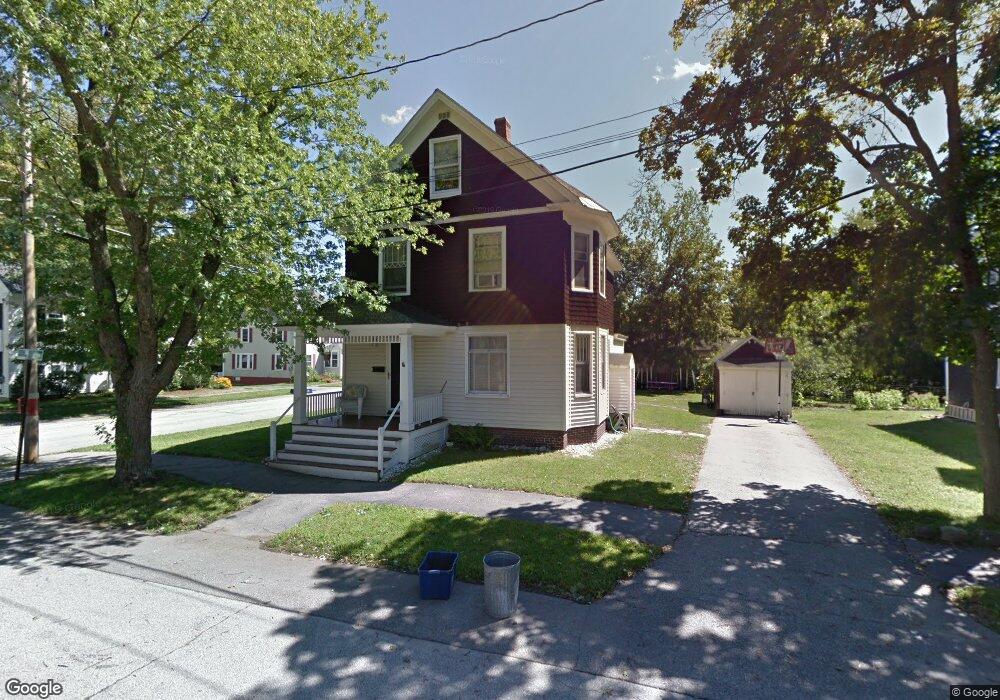
1 Humphrey St Concord, NH 03301
South End NeighborhoodEstimated Value: $423,000 - $527,000
4
Beds
2
Baths
1,694
Sq Ft
$284/Sq Ft
Est. Value
About This Home
This home is located at 1 Humphrey St, Concord, NH 03301 and is currently estimated at $480,481, approximately $283 per square foot. 1 Humphrey St is a home located in Merrimack County with nearby schools including Abbot-Downing School, Rundlett Middle School, and Concord High School.
Ownership History
Date
Name
Owned For
Owner Type
Purchase Details
Closed on
Apr 25, 2005
Sold by
Keyes Daniel R and Keyes Ann M
Bought by
Emmons Mark W
Current Estimated Value
Home Financials for this Owner
Home Financials are based on the most recent Mortgage that was taken out on this home.
Original Mortgage
$220,000
Interest Rate
5.87%
Mortgage Type
Purchase Money Mortgage
Create a Home Valuation Report for This Property
The Home Valuation Report is an in-depth analysis detailing your home's value as well as a comparison with similar homes in the area
Home Values in the Area
Average Home Value in this Area
Purchase History
| Date | Buyer | Sale Price | Title Company |
|---|---|---|---|
| Emmons Mark W | $275,000 | -- |
Source: Public Records
Mortgage History
| Date | Status | Borrower | Loan Amount |
|---|---|---|---|
| Open | Emmons Mark W | $212,400 | |
| Closed | Emmons Mark W | $220,000 |
Source: Public Records
Tax History Compared to Growth
Tax History
| Year | Tax Paid | Tax Assessment Tax Assessment Total Assessment is a certain percentage of the fair market value that is determined by local assessors to be the total taxable value of land and additions on the property. | Land | Improvement |
|---|---|---|---|---|
| 2024 | $8,097 | $292,400 | $105,200 | $187,200 |
| 2023 | $7,854 | $292,400 | $105,200 | $187,200 |
| 2022 | $7,570 | $292,400 | $105,200 | $187,200 |
| 2021 | $7,328 | $291,700 | $105,200 | $186,500 |
| 2020 | $7,212 | $269,500 | $87,900 | $181,600 |
| 2019 | $6,962 | $250,600 | $88,600 | $162,000 |
| 2018 | $6,568 | $233,000 | $88,600 | $144,400 |
| 2017 | $6,272 | $222,100 | $87,000 | $135,100 |
| 2016 | $5,894 | $213,000 | $87,000 | $126,000 |
| 2015 | $5,632 | $199,300 | $76,100 | $123,200 |
| 2014 | $5,343 | $199,300 | $76,100 | $123,200 |
| 2013 | -- | $198,100 | $76,100 | $122,000 |
| 2012 | -- | $208,500 | $76,100 | $132,400 |
Source: Public Records
Map
Nearby Homes
- 0 Spruce St Unit 88
- 33 Spruce St
- 12 Avon St
- 24 Badger St
- 122 South St
- 47 South St
- 14 Downing St
- 105 S Main St
- 75 S State St
- 14-16 Perley St
- 10 Perley St
- 0 South St Unit 4969509
- 87 S Main St Unit 2
- 4 Fayette St
- 54 Pleasant St Unit 8
- 15 Wilson Ave
- 22 Wilson Ave
- 376 S Main St
- 2 Kensington Rd
- 1 Kensington Rd