Estimated Value: $1,774,337 - $2,039,000
5
Beds
4
Baths
4,225
Sq Ft
$445/Sq Ft
Est. Value
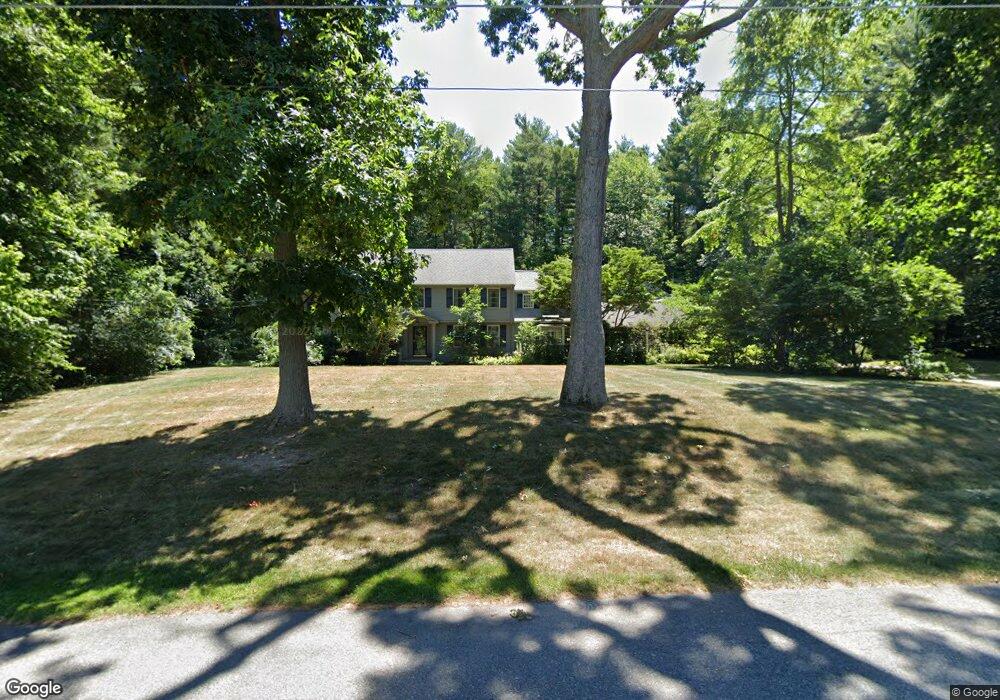
About This Home
This home is located at 1 Indian Spring Rd, Dover, MA 02030 and is currently estimated at $1,880,084, approximately $444 per square foot. 1 Indian Spring Rd is a home located in Norfolk County with nearby schools including Chickering Elementary School, Dover-Sherborn Regional Middle School, and Dover-Sherborn Regional High School.
Ownership History
Date
Name
Owned For
Owner Type
Purchase Details
Closed on
Aug 11, 2008
Sold by
Sullivan William and Sullivan Michele T
Bought by
Sullivan Michele T
Current Estimated Value
Home Financials for this Owner
Home Financials are based on the most recent Mortgage that was taken out on this home.
Original Mortgage
$502,000
Outstanding Balance
$329,800
Interest Rate
6.35%
Mortgage Type
Purchase Money Mortgage
Estimated Equity
$1,550,284
Purchase Details
Closed on
Jul 25, 2008
Sold by
Sullivan Michele T
Bought by
Sullivan Michele T and Sullivan William
Home Financials for this Owner
Home Financials are based on the most recent Mortgage that was taken out on this home.
Original Mortgage
$502,000
Outstanding Balance
$329,800
Interest Rate
6.35%
Mortgage Type
Purchase Money Mortgage
Estimated Equity
$1,550,284
Create a Home Valuation Report for This Property
The Home Valuation Report is an in-depth analysis detailing your home's value as well as a comparison with similar homes in the area
Home Values in the Area
Average Home Value in this Area
Purchase History
| Date | Buyer | Sale Price | Title Company |
|---|---|---|---|
| Sullivan Michele T | -- | -- | |
| Sullivan Michele T | -- | -- |
Source: Public Records
Mortgage History
| Date | Status | Borrower | Loan Amount |
|---|---|---|---|
| Open | Sullivan Michele T | $502,000 |
Source: Public Records
Tax History
| Year | Tax Paid | Tax Assessment Tax Assessment Total Assessment is a certain percentage of the fair market value that is determined by local assessors to be the total taxable value of land and additions on the property. | Land | Improvement |
|---|---|---|---|---|
| 2025 | $17,310 | $1,535,900 | $752,800 | $783,100 |
| 2024 | $16,311 | $1,488,200 | $752,800 | $735,400 |
| 2023 | $15,868 | $1,301,700 | $657,200 | $644,500 |
| 2022 | $14,594 | $1,175,000 | $602,800 | $572,200 |
| 2021 | $14,898 | $1,155,800 | $602,800 | $553,000 |
| 2020 | $14,840 | $1,155,800 | $602,800 | $553,000 |
| 2019 | $14,944 | $1,155,800 | $602,800 | $553,000 |
| 2018 | $13,758 | $1,071,500 | $548,300 | $523,200 |
| 2017 | $14,174 | $1,086,100 | $548,300 | $537,800 |
| 2016 | $13,639 | $1,058,900 | $521,100 | $537,800 |
| 2015 | $13,448 | $1,058,900 | $521,100 | $537,800 |
Source: Public Records
Map
Nearby Homes
Your Personal Tour Guide
Ask me questions while you tour the home.