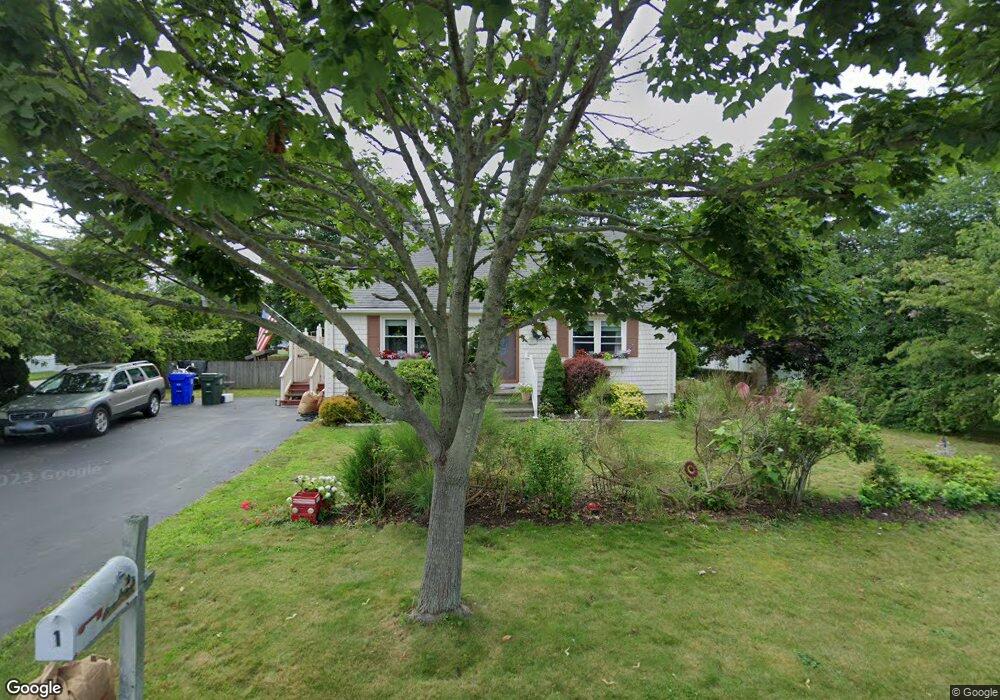
1 Jenkins St Bristol, RI 02809
Mount Hope NeighborhoodEstimated Value: $513,859 - $624,000
4
Beds
2
Baths
1,547
Sq Ft
$358/Sq Ft
Est. Value
About This Home
This home is located at 1 Jenkins St, Bristol, RI 02809 and is currently estimated at $553,965, approximately $358 per square foot. 1 Jenkins St is a home located in Bristol County with nearby schools including Mt. Hope High School, Our Lady of Mt. Carmel School, and East Bay Career Academy.
Ownership History
Date
Name
Owned For
Owner Type
Purchase Details
Closed on
Jul 15, 2025
Sold by
Pickering Michael H and Pickering Elinor L
Bought by
Pickering
Current Estimated Value
Purchase Details
Closed on
Dec 28, 2001
Sold by
Joyal Richard E and Joyal Kristin
Bought by
Pickering Michael and Pickering Elinor
Home Financials for this Owner
Home Financials are based on the most recent Mortgage that was taken out on this home.
Original Mortgage
$115,000
Interest Rate
6.61%
Purchase Details
Closed on
Jan 30, 1995
Sold by
Fonseca Kevin M
Bought by
Joyal Richard E and Joyal Kristen
Purchase Details
Closed on
Jul 8, 1991
Sold by
Rodrigues Robert T
Bought by
Fonseca Kevin M
Create a Home Valuation Report for This Property
The Home Valuation Report is an in-depth analysis detailing your home's value as well as a comparison with similar homes in the area
Home Values in the Area
Average Home Value in this Area
Purchase History
| Date | Buyer | Sale Price | Title Company |
|---|---|---|---|
| Pickering | -- | -- | |
| Pickering | -- | -- | |
| Pickering Michael | $187,500 | -- | |
| Pickering Michael | $187,500 | -- | |
| Joyal Richard E | $124,000 | -- | |
| Joyal Richard E | $124,000 | -- | |
| Fonseca Kevin M | $125,000 | -- | |
| Fonseca Kevin M | $125,000 | -- |
Source: Public Records
Mortgage History
| Date | Status | Borrower | Loan Amount |
|---|---|---|---|
| Previous Owner | Fonseca Kevin M | $60,000 | |
| Previous Owner | Fonseca Kevin M | $115,000 |
Source: Public Records
Tax History Compared to Growth
Tax History
| Year | Tax Paid | Tax Assessment Tax Assessment Total Assessment is a certain percentage of the fair market value that is determined by local assessors to be the total taxable value of land and additions on the property. | Land | Improvement |
|---|---|---|---|---|
| 2025 | $4,697 | $339,900 | $142,700 | $197,200 |
| 2024 | $4,697 | $339,900 | $142,700 | $197,200 |
| 2023 | $4,541 | $339,900 | $142,700 | $197,200 |
| 2022 | $3,999 | $339,900 | $142,700 | $197,200 |
| 2021 | $3,680 | $282,300 | $131,400 | $150,900 |
| 2020 | $3,972 | $282,300 | $131,400 | $150,900 |
| 2019 | $3,873 | $282,300 | $131,400 | $150,900 |
| 2018 | $4,302 | $279,700 | $125,400 | $154,300 |
| 2017 | $3,442 | $230,700 | $108,700 | $122,000 |
| 2016 | $3,407 | $230,700 | $108,700 | $122,000 |
| 2015 | $3,237 | $230,700 | $108,700 | $122,000 |
| 2014 | $3,451 | $264,230 | $135,900 | $128,330 |
Source: Public Records
Map
Nearby Homes
- 79 Hopeworth Ave
- 70 Magnolia St
- 6 Scott Ln
- 22 Magnolia St
- 214 Franklin St
- 2 Chilton St
- 2 Wilson St
- 107 Franklin St
- 48 Narrows Rd
- 53 Catherine St
- 413 High St
- 82 Charles St
- 291 High St
- 694 Hope St
- 44 Bradford St Unit 48
- 44 Bradford St Unit 49
- 44 Bradford St Unit 52
- 38 Collins St
- 21 Bradford St Unit 2
- 18 State St Unit 5 (3rd Floor East)