1 Jordan Dr Biddeford, ME 04005
Estimated Value: $526,000 - $730,000
2
Beds
3
Baths
1,278
Sq Ft
$475/Sq Ft
Est. Value
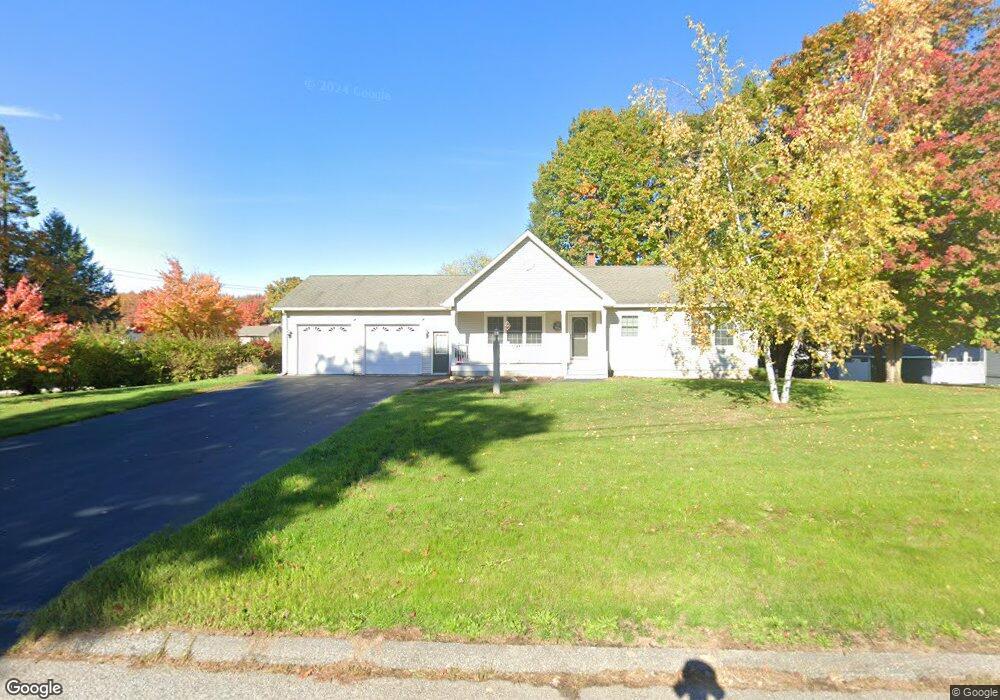
About This Home
This home is located at 1 Jordan Dr, Biddeford, ME 04005 and is currently estimated at $606,911, approximately $474 per square foot. 1 Jordan Dr is a home located in York County with nearby schools including John F Kennedy Memorial School, Biddeford Primary School, and Biddeford Intermediate School.
Ownership History
Date
Name
Owned For
Owner Type
Purchase Details
Closed on
Dec 17, 2013
Sold by
Paquette Roger R and Paquette Denise
Bought by
Perry Ryan P
Current Estimated Value
Home Financials for this Owner
Home Financials are based on the most recent Mortgage that was taken out on this home.
Original Mortgage
$235,500
Outstanding Balance
$175,533
Interest Rate
4.14%
Mortgage Type
New Conventional
Estimated Equity
$431,378
Purchase Details
Closed on
Nov 27, 2006
Sold by
Paquette Roger E
Bought by
Gagnon Roger R
Create a Home Valuation Report for This Property
The Home Valuation Report is an in-depth analysis detailing your home's value as well as a comparison with similar homes in the area
Home Values in the Area
Average Home Value in this Area
Purchase History
| Date | Buyer | Sale Price | Title Company |
|---|---|---|---|
| Perry Ryan P | -- | -- | |
| Perry Ryan P | -- | -- | |
| Gagnon Roger R | -- | -- | |
| Gagnon Roger R | -- | -- |
Source: Public Records
Mortgage History
| Date | Status | Borrower | Loan Amount |
|---|---|---|---|
| Open | Perry Ryan P | $235,500 | |
| Closed | Gagnon Roger R | $235,500 |
Source: Public Records
Tax History Compared to Growth
Tax History
| Year | Tax Paid | Tax Assessment Tax Assessment Total Assessment is a certain percentage of the fair market value that is determined by local assessors to be the total taxable value of land and additions on the property. | Land | Improvement |
|---|---|---|---|---|
| 2024 | $6,288 | $442,200 | $167,600 | $274,600 |
| 2023 | $5,765 | $439,400 | $164,800 | $274,600 |
| 2022 | $5,857 | $356,900 | $94,800 | $262,100 |
| 2021 | $5,591 | $306,700 | $81,700 | $225,000 |
| 2020 | $2,724 | $279,500 | $72,000 | $207,500 |
| 2019 | $2,647 | $279,500 | $72,000 | $207,500 |
| 2018 | $5,506 | $279,500 | $72,000 | $207,500 |
| 2017 | $5,349 | $253,300 | $72,000 | $181,300 |
| 2016 | $5,218 | $253,300 | $72,000 | $181,300 |
| 2015 | $4,932 | $253,300 | $72,000 | $181,300 |
| 2014 | $4,810 | $253,300 | $72,000 | $181,300 |
| 2013 | -- | $279,500 | $79,000 | $200,500 |
Source: Public Records
Map
Nearby Homes