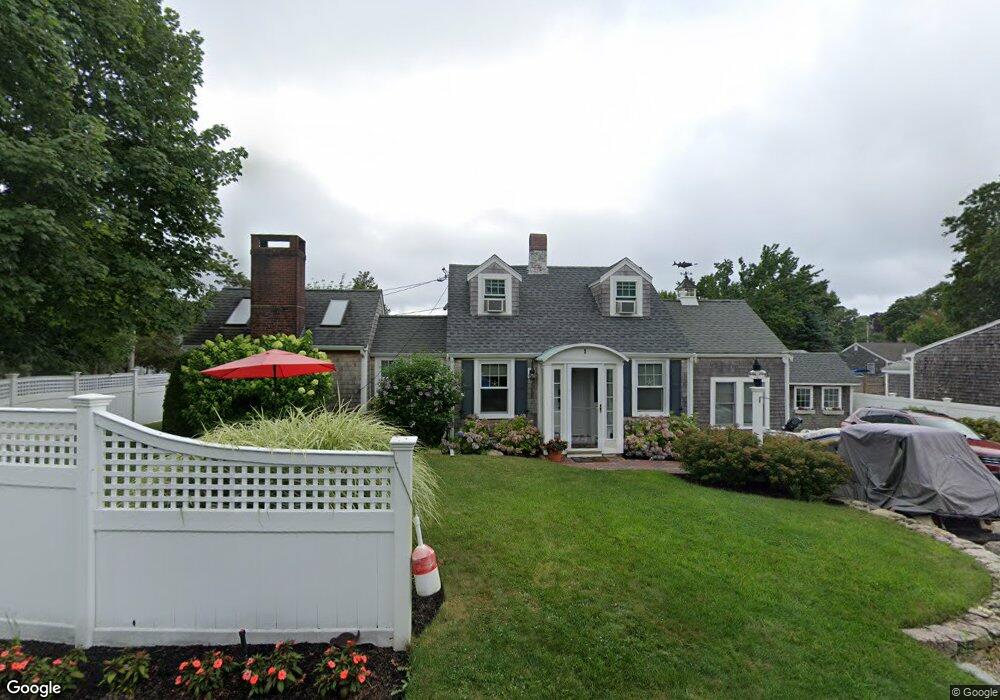
1 King Phillip Rd Pocasset, MA 02559
Pocasset NeighborhoodEstimated Value: $720,000 - $895,380
3
Beds
1
Bath
1,094
Sq Ft
$737/Sq Ft
Est. Value
About This Home
This home is located at 1 King Phillip Rd, Pocasset, MA 02559 and is currently estimated at $806,345, approximately $737 per square foot. 1 King Phillip Rd is a home located in Barnstable County with nearby schools including Bourne High School, Cadence Academy Preschool - Bourne, and St Margaret Regional School.
Ownership History
Date
Name
Owned For
Owner Type
Purchase Details
Closed on
Apr 3, 2007
Sold by
Sharek Paul N
Bought by
Matz Jeanne and Matz Paul D
Current Estimated Value
Home Financials for this Owner
Home Financials are based on the most recent Mortgage that was taken out on this home.
Original Mortgage
$284,000
Outstanding Balance
$171,706
Interest Rate
6.33%
Mortgage Type
Purchase Money Mortgage
Estimated Equity
$634,639
Create a Home Valuation Report for This Property
The Home Valuation Report is an in-depth analysis detailing your home's value as well as a comparison with similar homes in the area
Home Values in the Area
Average Home Value in this Area
Purchase History
| Date | Buyer | Sale Price | Title Company |
|---|---|---|---|
| Matz Jeanne | $355,000 | -- | |
| Matz Jeanne | $355,000 | -- |
Source: Public Records
Mortgage History
| Date | Status | Borrower | Loan Amount |
|---|---|---|---|
| Open | Matz Jeanne | $284,000 | |
| Closed | Matz Jeanne | $284,000 | |
| Previous Owner | Matz Jeanne | $50,222 |
Source: Public Records
Tax History Compared to Growth
Tax History
| Year | Tax Paid | Tax Assessment Tax Assessment Total Assessment is a certain percentage of the fair market value that is determined by local assessors to be the total taxable value of land and additions on the property. | Land | Improvement |
|---|---|---|---|---|
| 2025 | $6,259 | $801,400 | $424,700 | $376,700 |
| 2024 | $5,646 | $704,000 | $404,500 | $299,500 |
| 2023 | $4,755 | $539,700 | $315,000 | $224,700 |
| 2022 | $4,300 | $426,200 | $247,100 | $179,100 |
| 2021 | $4,184 | $388,500 | $224,900 | $163,600 |
| 2020 | $3,993 | $371,800 | $222,700 | $149,100 |
| 2019 | $3,822 | $363,700 | $222,700 | $141,000 |
| 2018 | $3,649 | $346,200 | $217,600 | $128,600 |
| 2017 | $3,615 | $351,000 | $237,100 | $113,900 |
| 2016 | $3,325 | $327,300 | $215,600 | $111,700 |
| 2015 | $3,296 | $327,300 | $215,600 | $111,700 |
Source: Public Records
Map
Nearby Homes