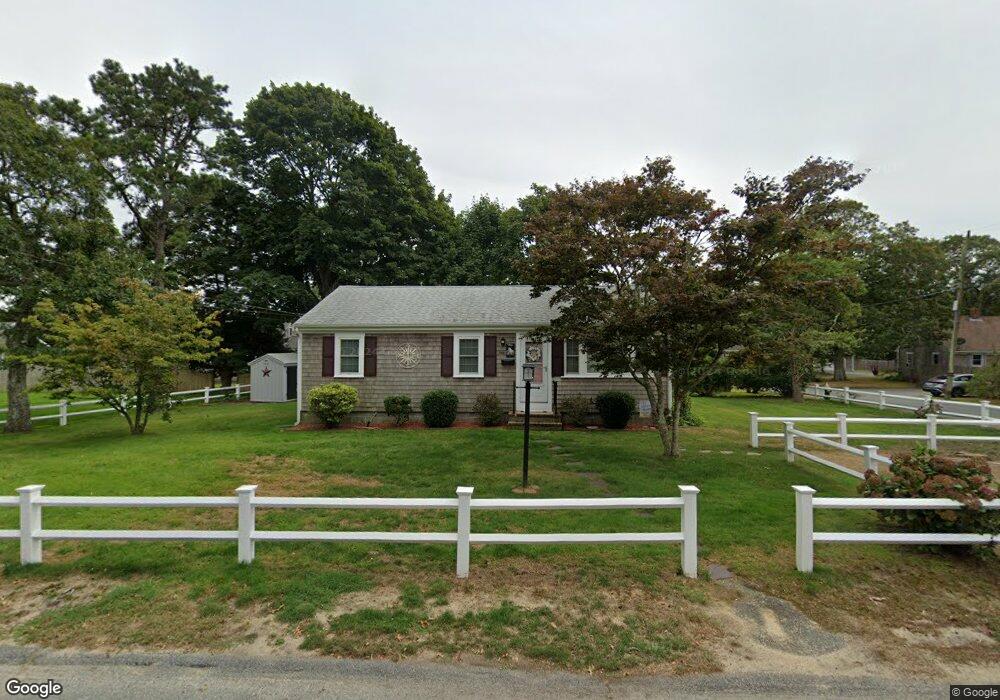
1 Lauries Ln South Yarmouth, MA 02664
Estimated Value: $502,000 - $560,000
3
Beds
1
Bath
800
Sq Ft
$659/Sq Ft
Est. Value
About This Home
This home is located at 1 Lauries Ln, South Yarmouth, MA 02664 and is currently estimated at $526,963, approximately $658 per square foot. 1 Lauries Ln is a home located in Barnstable County with nearby schools including Dennis-Yarmouth Regional High School.
Ownership History
Date
Name
Owned For
Owner Type
Purchase Details
Closed on
Dec 23, 1999
Sold by
Obrien Richard S and Obrien Marilyn J
Bought by
Braccialarghe Donald and Braccialarghe Deborah
Current Estimated Value
Home Financials for this Owner
Home Financials are based on the most recent Mortgage that was taken out on this home.
Original Mortgage
$94,800
Interest Rate
7.61%
Mortgage Type
Purchase Money Mortgage
Purchase Details
Closed on
Oct 27, 1989
Sold by
Keren Thomas D
Bought by
Obrien Richard S
Create a Home Valuation Report for This Property
The Home Valuation Report is an in-depth analysis detailing your home's value as well as a comparison with similar homes in the area
Home Values in the Area
Average Home Value in this Area
Purchase History
| Date | Buyer | Sale Price | Title Company |
|---|---|---|---|
| Braccialarghe Donald | $118,500 | -- | |
| Obrien Richard S | $107,000 | -- |
Source: Public Records
Mortgage History
| Date | Status | Borrower | Loan Amount |
|---|---|---|---|
| Closed | Obrien Richard S | $129,729 | |
| Closed | Obrien Richard S | $94,800 | |
| Closed | Obrien Richard S | $11,850 |
Source: Public Records
Tax History Compared to Growth
Tax History
| Year | Tax Paid | Tax Assessment Tax Assessment Total Assessment is a certain percentage of the fair market value that is determined by local assessors to be the total taxable value of land and additions on the property. | Land | Improvement |
|---|---|---|---|---|
| 2025 | $3,018 | $426,300 | $148,600 | $277,700 |
| 2024 | $2,835 | $384,100 | $129,200 | $254,900 |
| 2023 | $2,782 | $343,000 | $117,400 | $225,600 |
| 2022 | $2,672 | $291,100 | $112,100 | $179,000 |
| 2021 | $2,518 | $263,400 | $112,100 | $151,300 |
| 2020 | $2,552 | $255,200 | $118,600 | $136,600 |
| 2019 | $2,298 | $227,500 | $118,600 | $108,900 |
| 2018 | $2,138 | $207,800 | $98,900 | $108,900 |
| 2017 | $2,082 | $207,800 | $98,900 | $108,900 |
| 2016 | $1,995 | $199,900 | $91,000 | $108,900 |
| 2015 | $1,851 | $184,400 | $87,000 | $97,400 |
Source: Public Records
Map
Nearby Homes