1 Main St Nashua, NH 03064
North End Nashua Neighborhood
--
Bed
--
Bath
9,581
Sq Ft
0.53
Acres
About This Home
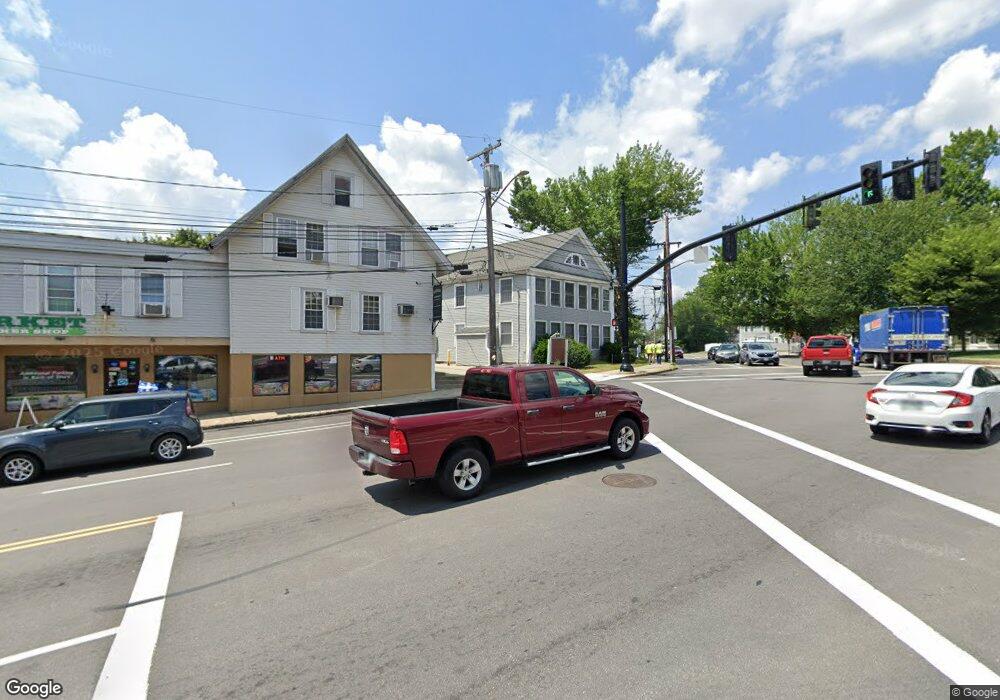
This home is located at 1 Main St, Nashua, NH 03064. 1 Main St is a home located in Hillsborough County with nearby schools including Amherst Street School, Pennichuck Middle School, and Nashua High School North.
Ownership History
Date
Name
Owned For
Owner Type
Purchase Details
Closed on
Mar 26, 2021
Sold by
Pillman Joanne T and Savino Joanne T
Bought by
Savino Joseph
Purchase Details
Closed on
Jun 12, 2006
Sold by
Washburn Michael and Washburn Kathleen
Bought by
Washburn Ryan M and Washburn Sara L
Home Financials for this Owner
Home Financials are based on the most recent Mortgage that was taken out on this home.
Original Mortgage
$105,000
Interest Rate
6.62%
Mortgage Type
Commercial
Purchase Details
Closed on
Sep 5, 2002
Sold by
Wisch Judith C
Bought by
Inglis Leslie and Inglis Alexander
Home Financials for this Owner
Home Financials are based on the most recent Mortgage that was taken out on this home.
Original Mortgage
$158,650
Interest Rate
6.39%
Mortgage Type
Commercial
Purchase Details
Closed on
Sep 14, 1999
Sold by
Singl Thomas A
Bought by
Wisch Judith C
Purchase Details
Closed on
May 31, 1996
Sold by
Fnma
Bought by
King Gerald R
Purchase Details
Closed on
Dec 8, 1993
Bought by
E & S Greenwald Ft
Create a Home Valuation Report for This Property
The Home Valuation Report is an in-depth analysis detailing your home's value as well as a comparison with similar homes in the area
Home Values in the Area
Average Home Value in this Area
Purchase History
| Date | Buyer | Sale Price | Title Company |
|---|---|---|---|
| Savino Joseph | $245,600 | None Available | |
| Savino Joseph | $245,600 | None Available | |
| Washburn Ryan M | $105,000 | -- | |
| Washburn Ryan M | $105,000 | -- | |
| Inglis Leslie | $170,000 | -- | |
| Inglis Leslie | $170,000 | -- | |
| Wisch Judith C | $112,500 | -- | |
| Wisch Judith C | $112,500 | -- | |
| King Gerald R | $54,600 | -- | |
| King Gerald R | $54,600 | -- | |
| E & S Greenwald Ft | $125,000 | -- |
Source: Public Records
Mortgage History
| Date | Status | Borrower | Loan Amount |
|---|---|---|---|
| Previous Owner | E & S Greenwald Ft | $105,000 | |
| Previous Owner | E & S Greenwald Ft | $158,650 |
Source: Public Records
Tax History Compared to Growth
Tax History
| Year | Tax Paid | Tax Assessment Tax Assessment Total Assessment is a certain percentage of the fair market value that is determined by local assessors to be the total taxable value of land and additions on the property. | Land | Improvement |
|---|---|---|---|---|
| 2024 | $14,224 | $894,600 | $231,200 | $663,400 |
| 2023 | $13,182 | $723,100 | $201,200 | $521,900 |
| 2022 | $13,066 | $723,100 | $201,200 | $521,900 |
| 2021 | $17,239 | $742,400 | $191,500 | $550,900 |
| 2020 | $16,786 | $742,400 | $191,500 | $550,900 |
| 2019 | $16,155 | $742,400 | $191,500 | $550,900 |
| 2018 | $15,746 | $742,400 | $191,500 | $550,900 |
| 2017 | $18,497 | $717,200 | $211,100 | $506,100 |
| 2016 | $17,980 | $717,200 | $211,100 | $506,100 |
| 2015 | $17,593 | $717,200 | $211,100 | $506,100 |
| 2014 | $17,249 | $717,200 | $211,100 | $506,100 |
Source: Public Records
Map
Nearby Homes
- 52 Main St Unit 402
- 11 Charles St
- 38 Central St
- 0 Baldwin St
- 36-38 Courtland St
- 30 Ledge St
- 5 Mulberry St
- 7 Bitirnas St Unit U7
- 155 Tolles St
- 4 Reservoir St
- 71 Concord St
- 61 Manchester St
- 8 Buck St Unit 10
- 18 Harbor Ave Unit 208
- 13 Sapphire Ln
- 15 Atherton Ave
- 19 Atherton Ave
- 22 Wilder St
- 4 Badger St
- 24 E Otterson St
- 79 Fletcher St
- 7 Fletcher St
- 11-13 Fletcher St
- 11 Fletcher St Unit 13
- 10 Amherst St
- 15 Fletcher St Unit 17
- 14 Amherst St
- 9 9th St
- 12 Fletcher St Unit 14
- 6 Main St
- 7 Thayer Ct
- 21 Main St
- 17 Thayer Ct Unit 19
- 18 Fletcher St Unit 130
- 23 Fletcher St
- 23 Fletcher St Unit A & B
- 23 Fletcher St Unit 23 C
- 1 Concord St
- 13-15 Thayer Ct
- 6 Auburn St