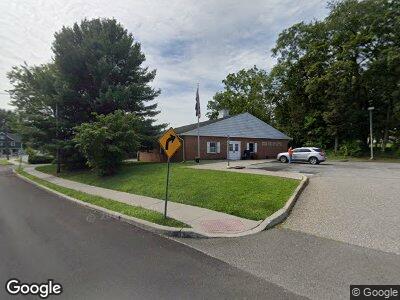
1 Main St Neshanic Station, NJ 08853
Estimated Value: $844,699 - $1,053,000
--
Bed
--
Bath
2,324
Sq Ft
$413/Sq Ft
Est. Value
About This Home
This home is located at 1 Main St, Neshanic Station, NJ 08853 and is currently estimated at $960,175, approximately $413 per square foot. 1 Main St is a home with nearby schools including Bedwell Elementary School, Bernardsville Middle School, and Bernards High School.
Ownership History
Date
Name
Owned For
Owner Type
Purchase Details
Closed on
Aug 13, 2004
Sold by
Williamson Denise C
Bought by
Yelenik Stephan and Wolfson Leslie
Current Estimated Value
Home Financials for this Owner
Home Financials are based on the most recent Mortgage that was taken out on this home.
Original Mortgage
$310,000
Interest Rate
6.16%
Purchase Details
Closed on
Nov 12, 1992
Sold by
Williamson Jr Clifford Edward
Bought by
Williamson Denise C
Create a Home Valuation Report for This Property
The Home Valuation Report is an in-depth analysis detailing your home's value as well as a comparison with similar homes in the area
Home Values in the Area
Average Home Value in this Area
Purchase History
| Date | Buyer | Sale Price | Title Company |
|---|---|---|---|
| Yelenik Stephan | $635,000 | -- | |
| Williamson Denise C | -- | -- |
Source: Public Records
Mortgage History
| Date | Status | Borrower | Loan Amount |
|---|---|---|---|
| Open | Leslie | $162,325 | |
| Closed | Yelenik Stephan | $221,586 | |
| Closed | Yelenik Stephan | $232,129 | |
| Closed | Yelenik Stephan | $240,045 | |
| Closed | Yelenik Stephan | $310,000 |
Source: Public Records
Tax History Compared to Growth
Tax History
| Year | Tax Paid | Tax Assessment Tax Assessment Total Assessment is a certain percentage of the fair market value that is determined by local assessors to be the total taxable value of land and additions on the property. | Land | Improvement |
|---|---|---|---|---|
| 2024 | $11,911 | $697,800 | $346,200 | $351,600 |
| 2023 | $11,783 | $663,100 | $339,100 | $324,000 |
| 2022 | $11,767 | $640,200 | $326,000 | $314,200 |
| 2021 | $11,560 | $617,200 | $310,400 | $306,800 |
| 2020 | $11,513 | $612,700 | $307,300 | $305,400 |
| 2019 | $11,355 | $607,200 | $298,300 | $308,900 |
| 2018 | $11,322 | $602,900 | $295,600 | $307,300 |
| 2017 | $11,267 | $592,400 | $268,800 | $323,600 |
| 2016 | $11,288 | $588,200 | $268,800 | $319,400 |
| 2015 | $10,976 | $582,600 | $267,500 | $315,100 |
| 2014 | $10,976 | $577,700 | $267,500 | $310,200 |
Source: Public Records
Map
Nearby Homes
- 35 Main St
- 234 Deer Haven Rd
- 3 Brady Dr
- 43 Abby Rd
- 41 Abby Rd
- 45 Abby Rd Pendry Natirar
- 27 Highland Ave
- 25 Highland Ave
- 00 Private
- 0 Private Rd Unit 3966400
- 48 Sunny Branch Rd
- 47 Abby Rd
- 1595 U S 206
- 7 Perry St
- 15 Bedminster Terrace
- 17 Steeple Chase Ct
- 5 Polo Club Rd
- 2 Cowdray Pkwy
- 12 Peapack Rd
- 2250 Lamington Rd