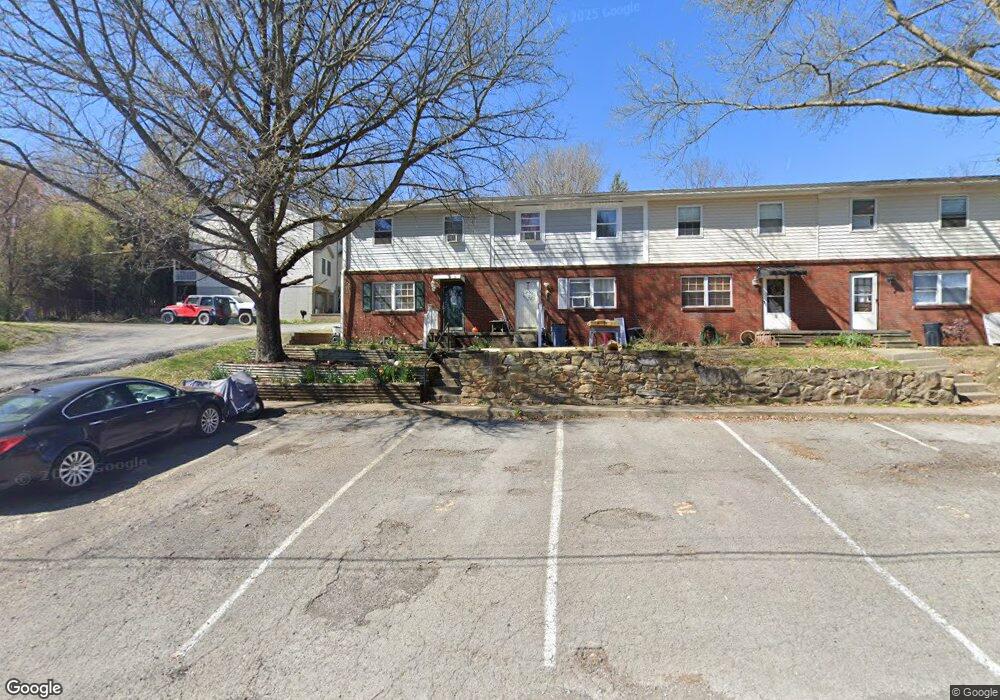
1 Marcus Dr Morgantown, WV 26501
Estimated Value: $184,000 - $203,000
2
Beds
2
Baths
1,131
Sq Ft
$170/Sq Ft
Est. Value
About This Home
This home is located at 1 Marcus Dr, Morgantown, WV 26501 and is currently estimated at $192,184, approximately $169 per square foot. 1 Marcus Dr is a home located in Monongalia County with nearby schools including Mountainview Elementary School, South Middle School, and Morgantown High School.
Ownership History
Date
Name
Owned For
Owner Type
Purchase Details
Closed on
Aug 28, 2020
Sold by
Hile Amy M
Bought by
Thompson Stephanie Kent
Current Estimated Value
Home Financials for this Owner
Home Financials are based on the most recent Mortgage that was taken out on this home.
Original Mortgage
$149,150
Outstanding Balance
$131,758
Interest Rate
2.9%
Mortgage Type
New Conventional
Estimated Equity
$60,426
Purchase Details
Closed on
Jul 20, 2012
Sold by
Condee Evan F
Bought by
Hile Amy M
Home Financials for this Owner
Home Financials are based on the most recent Mortgage that was taken out on this home.
Original Mortgage
$114,400
Interest Rate
3.7%
Mortgage Type
New Conventional
Purchase Details
Closed on
May 18, 2005
Sold by
S & S Development Llc
Bought by
Condee Evan F
Home Financials for this Owner
Home Financials are based on the most recent Mortgage that was taken out on this home.
Original Mortgage
$145,000
Interest Rate
5.5%
Mortgage Type
Adjustable Rate Mortgage/ARM
Create a Home Valuation Report for This Property
The Home Valuation Report is an in-depth analysis detailing your home's value as well as a comparison with similar homes in the area
Purchase History
| Date | Buyer | Sale Price | Title Company |
|---|---|---|---|
| Thompson Stephanie Kent | $157,000 | Bestitle Agency Inc | |
| Hile Amy M | $143,000 | None Available | |
| Condee Evan F | $145,000 | None Available |
Source: Public Records
Mortgage History
| Date | Status | Borrower | Loan Amount |
|---|---|---|---|
| Open | Thompson Stephanie Kent | $149,150 | |
| Previous Owner | Hile Amy M | $114,400 | |
| Previous Owner | Condee Evan F | $145,000 |
Source: Public Records
Tax History
| Year | Tax Paid | Tax Assessment Tax Assessment Total Assessment is a certain percentage of the fair market value that is determined by local assessors to be the total taxable value of land and additions on the property. | Land | Improvement |
|---|---|---|---|---|
| 2025 | $742 | $69,420 | $6,240 | $63,180 |
| 2024 | $742 | $70,080 | $6,240 | $63,840 |
| 2023 | $747 | $70,080 | $6,240 | $63,840 |
| 2022 | $706 | $68,880 | $6,240 | $62,640 |
| 2021 | $717 | $69,600 | $6,240 | $63,360 |
| 2020 | $720 | $69,600 | $6,240 | $63,360 |
| 2019 | $725 | $69,600 | $6,240 | $63,360 |
| 2018 | $734 | $70,200 | $6,240 | $63,960 |
| 2017 | $734 | $69,840 | $5,880 | $63,960 |
| 2016 | $738 | $69,840 | $5,880 | $63,960 |
| 2015 | $687 | $67,920 | $5,280 | $62,640 |
| 2014 | $645 | $66,900 | $5,100 | $61,800 |
Source: Public Records
Map
Nearby Homes
- 106 Apolla Dr
- 1103 Bailey Cir
- 248 Stonehurst Dr
- 242 Stonehurst Dr
- 959 Southpoint Cir
- 231 Stonehurst Dr
- 1310 Dorsey Ave
- 3204 Mountain View Manor
- 00 Stonehurst Dr
- 5204 Parkway Dr
- Lot 28 S Point Cir
- Lots 20 + 21 S Point Cir
- TBD Huntington Ave
- 769 Augusta Ave
- 0 Cooper St
- 160 Greenbrier St
- 608 E Brockway Ave
- TBD Karen Ln
- 17 Karen Ln
- 401 Conn St
Your Personal Tour Guide
Ask me questions while you tour the home.