Estimated Value: $320,000 - $357,000
2
Beds
2
Baths
1,011
Sq Ft
$335/Sq Ft
Est. Value
About This Home
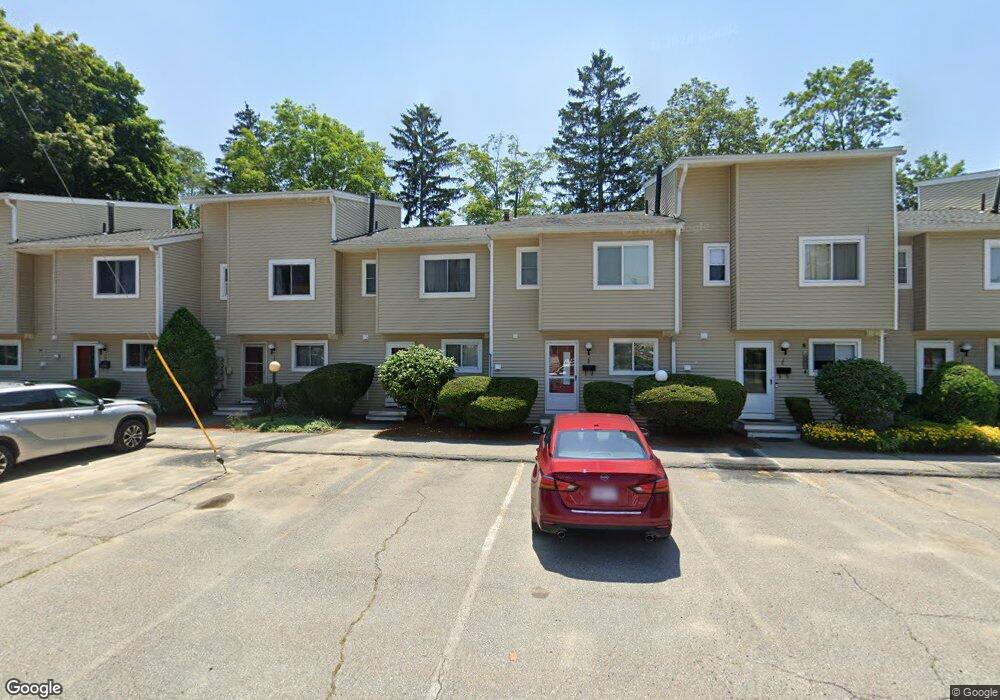
This home is located at 1 Markham Cir Unit C, Ayer, MA 01432 and is currently estimated at $338,280, approximately $334 per square foot. 1 Markham Cir Unit C is a home located in Middlesex County with nearby schools including Page Hilltop School, Lura A. White Elementary School, and Ayer Shirley Regional Middle School.
Ownership History
Date
Name
Owned For
Owner Type
Purchase Details
Closed on
Apr 10, 2025
Sold by
Slocombe Michael
Bought by
Slocombe Int and Slocombe S
Current Estimated Value
Purchase Details
Closed on
Nov 5, 2003
Sold by
Quin Judith D and Quin Thomas M
Bought by
Slocombe Michael
Home Financials for this Owner
Home Financials are based on the most recent Mortgage that was taken out on this home.
Original Mortgage
$130,800
Interest Rate
6.01%
Mortgage Type
Purchase Money Mortgage
Purchase Details
Closed on
Jan 19, 2001
Sold by
Dunn John E and Dunn Leontine S
Bought by
Williams Christopher and Williams Chelsea L
Home Financials for this Owner
Home Financials are based on the most recent Mortgage that was taken out on this home.
Original Mortgage
$75,000
Interest Rate
7.52%
Mortgage Type
Purchase Money Mortgage
Create a Home Valuation Report for This Property
The Home Valuation Report is an in-depth analysis detailing your home's value as well as a comparison with similar homes in the area
Home Values in the Area
Average Home Value in this Area
Purchase History
| Date | Buyer | Sale Price | Title Company |
|---|---|---|---|
| Slocombe Int | -- | None Available | |
| Slocombe Michael | $163,500 | -- | |
| Williams Christopher | $75,000 | -- |
Source: Public Records
Mortgage History
| Date | Status | Borrower | Loan Amount |
|---|---|---|---|
| Previous Owner | Slocombe Michael | $130,800 | |
| Previous Owner | Williams Christopher | $75,000 |
Source: Public Records
Tax History
| Year | Tax Paid | Tax Assessment Tax Assessment Total Assessment is a certain percentage of the fair market value that is determined by local assessors to be the total taxable value of land and additions on the property. | Land | Improvement |
|---|---|---|---|---|
| 2025 | $3,071 | $256,800 | $0 | $256,800 |
| 2024 | $2,598 | $212,100 | $0 | $212,100 |
| 2023 | $2,350 | $189,200 | $0 | $189,200 |
| 2022 | $2,314 | $172,400 | $0 | $172,400 |
| 2021 | $2,234 | $158,000 | $0 | $158,000 |
| 2020 | $2,154 | $152,800 | $0 | $152,800 |
| 2019 | $1,837 | $134,800 | $0 | $134,800 |
| 2018 | $1,795 | $124,400 | $0 | $124,400 |
| 2017 | $1,630 | $113,300 | $0 | $113,300 |
| 2016 | $1,498 | $103,100 | $0 | $103,100 |
| 2015 | $1,393 | $95,300 | $0 | $95,300 |
| 2014 | $1,342 | $95,300 | $0 | $95,300 |
Source: Public Records
Map
Nearby Homes
- 24 Harvard Rd Unit C
- 37 Willard St
- 7 Baldwin Ct Unit 7
- 100 Central Ave Unit 4
- 55 Littleton Rd Unit 21C
- 63 E Main St
- 25 Pine Ridge Dr
- 75 Sandy Pond Rd Unit 24
- 75 Sandy Pond Rd Unit 41
- 21 High St
- 23 Nashua St
- 0 Ayer & Old Mill Rd
- 9 Gaskins Ln
- 98 Pleasant St
- 78 Shaker Rd
- 14 Brook St
- 0ABC Park St
- 18A S Shaker Rd
- 17 Jonathan Dr
- 401 Autumn Ridge Dr
- 3 Markham Cir Unit D
- 3 Markham Cir Unit C
- 3 Markham Cir Unit B
- 3 Markham Cir Unit A
- 1 Markham Cir Unit D
- 1 Markham Cir Unit B
- 1 Markham Cir Unit A
- 1 Markham Cir Unit 1B
- 1A Markham Cir Unit 1A
- 1 Markham Cir Unit 1C
- 1A Markham Cir Unit 1 A
- 1 Markham Cir Unit 1A
- 3 Markham Cir Unit 3
- 7 Markham Cir
- 2F Markham Cir
- 2 Markham Cir Unit F
- 2 Markham Cir Unit E
- 2 Markham Cir Unit D
- 2 Markham Cir Unit B
- 2 Markham Cir Unit A
Your Personal Tour Guide
Ask me questions while you tour the home.