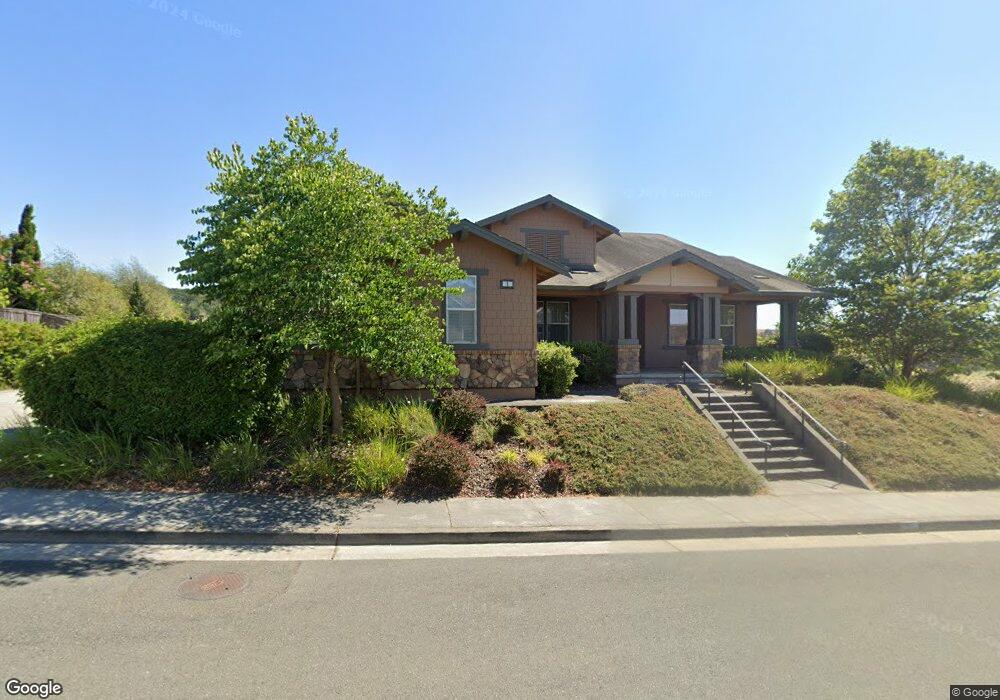
1 Marlie Ln Petaluma, CA 94952
Western Petaluma NeighborhoodEstimated Value: $1,543,000 - $2,096,000
4
Beds
3
Baths
3,266
Sq Ft
$537/Sq Ft
Est. Value
About This Home
This home is located at 1 Marlie Ln, Petaluma, CA 94952 and is currently estimated at $1,754,165, approximately $537 per square foot. 1 Marlie Ln is a home located in Sonoma County with nearby schools including Wilson Elementary School, Petaluma Junior High School, and Petaluma High School.
Ownership History
Date
Name
Owned For
Owner Type
Purchase Details
Closed on
Jun 8, 2012
Sold by
Goggin Donald
Bought by
Tam Anne
Current Estimated Value
Purchase Details
Closed on
Nov 15, 2005
Sold by
Rockridge Pointe Investors Lp
Bought by
Goggin Donald and Tam Anne
Home Financials for this Owner
Home Financials are based on the most recent Mortgage that was taken out on this home.
Original Mortgage
$663,000
Outstanding Balance
$353,889
Interest Rate
5.62%
Mortgage Type
Fannie Mae Freddie Mac
Estimated Equity
$1,400,276
Create a Home Valuation Report for This Property
The Home Valuation Report is an in-depth analysis detailing your home's value as well as a comparison with similar homes in the area
Home Values in the Area
Average Home Value in this Area
Purchase History
| Date | Buyer | Sale Price | Title Company |
|---|---|---|---|
| Tam Anne | -- | None Available | |
| Goggin Donald | $1,063,000 | First American Title Co |
Source: Public Records
Mortgage History
| Date | Status | Borrower | Loan Amount |
|---|---|---|---|
| Open | Goggin Donald | $663,000 |
Source: Public Records
Tax History
| Year | Tax Paid | Tax Assessment Tax Assessment Total Assessment is a certain percentage of the fair market value that is determined by local assessors to be the total taxable value of land and additions on the property. | Land | Improvement |
|---|---|---|---|---|
| 2025 | $15,392 | $1,452,529 | $546,628 | $905,901 |
| 2024 | $15,392 | $1,424,049 | $535,910 | $888,139 |
| 2023 | $15,392 | $1,396,127 | $525,402 | $870,725 |
| 2022 | $15,066 | $1,368,752 | $515,100 | $853,652 |
| 2021 | $14,726 | $1,341,914 | $505,000 | $836,914 |
| 2020 | $14,840 | $1,328,155 | $499,822 | $828,333 |
| 2019 | $14,603 | $1,302,114 | $490,022 | $812,092 |
| 2018 | $14,521 | $1,276,583 | $480,414 | $796,169 |
| 2017 | $14,275 | $1,251,553 | $470,995 | $780,558 |
| 2016 | $13,839 | $1,227,013 | $461,760 | $765,253 |
| 2015 | $11,580 | $1,035,000 | $389,000 | $646,000 |
| 2014 | $9,979 | $884,000 | $333,000 | $551,000 |
Source: Public Records
Map
Nearby Homes
Your Personal Tour Guide
Ask me questions while you tour the home.