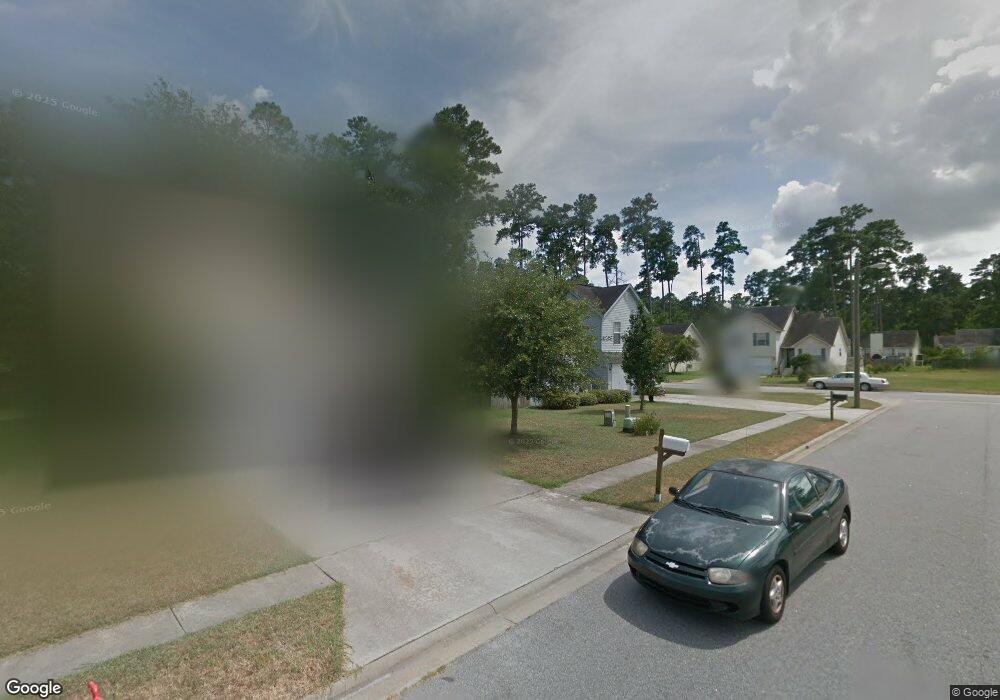
1 Marsh Hen Ct Savannah, GA 31419
Estimated Value: $281,000 - $301,000
3
Beds
2
Baths
1,381
Sq Ft
$211/Sq Ft
Est. Value
About This Home
This home is located at 1 Marsh Hen Ct, Savannah, GA 31419 and is currently estimated at $290,878, approximately $210 per square foot. 1 Marsh Hen Ct is a home located in Chatham County with nearby schools including Southwest Elementary School, Windsor Forest High School, and Southwest Middle School.
Ownership History
Date
Name
Owned For
Owner Type
Purchase Details
Closed on
Oct 4, 2014
Sold by
American Homes 4 Rent Prop
Bought by
Amh 2014 2 Borrower Llc
Current Estimated Value
Home Financials for this Owner
Home Financials are based on the most recent Mortgage that was taken out on this home.
Original Mortgage
$513,316
Outstanding Balance
$393,122
Interest Rate
4.15%
Mortgage Type
New Conventional
Estimated Equity
-$102,244
Purchase Details
Closed on
Sep 19, 2014
Sold by
American Homes 4 Rent Properti
Bought by
Amh 2014 2 Borrower Llc
Home Financials for this Owner
Home Financials are based on the most recent Mortgage that was taken out on this home.
Original Mortgage
$513,316
Outstanding Balance
$393,122
Interest Rate
4.15%
Mortgage Type
New Conventional
Estimated Equity
-$102,244
Purchase Details
Closed on
Feb 4, 2014
Sold by
Williams Bierdie Lundy
Bought by
American Homes 4 Rent Properti
Create a Home Valuation Report for This Property
The Home Valuation Report is an in-depth analysis detailing your home's value as well as a comparison with similar homes in the area
Home Values in the Area
Average Home Value in this Area
Purchase History
| Date | Buyer | Sale Price | Title Company |
|---|---|---|---|
| Amh 2014 2 Borrower Llc | -- | -- | |
| Amh 2014 2 Borrower Llc | -- | -- | |
| American Homes 4 Rent Properti | $90,091 | -- |
Source: Public Records
Mortgage History
| Date | Status | Borrower | Loan Amount |
|---|---|---|---|
| Open | Amh 2014 2 Borrower Llc | $513,316 |
Source: Public Records
Tax History Compared to Growth
Tax History
| Year | Tax Paid | Tax Assessment Tax Assessment Total Assessment is a certain percentage of the fair market value that is determined by local assessors to be the total taxable value of land and additions on the property. | Land | Improvement |
|---|---|---|---|---|
| 2025 | $2,946 | $115,040 | $22,000 | $93,040 |
| 2024 | $2,946 | $115,720 | $22,000 | $93,720 |
| 2023 | $2,856 | $81,360 | $16,000 | $65,360 |
| 2022 | $2,048 | $74,960 | $16,000 | $58,960 |
| 2021 | $2,169 | $57,480 | $8,800 | $48,680 |
| 2020 | $1,960 | $55,880 | $8,800 | $47,080 |
| 2019 | $2,074 | $53,720 | $8,800 | $44,920 |
| 2018 | $2,078 | $53,720 | $8,800 | $44,920 |
| 2017 | $1,770 | $53,720 | $8,800 | $44,920 |
| 2016 | $1,707 | $49,080 | $8,800 | $40,280 |
| 2015 | $1,728 | $49,640 | $8,800 | $40,840 |
| 2014 | $1,967 | $50,760 | $0 | $0 |
Source: Public Records
Map
Nearby Homes
- 30 Orchid Ln
- 34 Orchid Ln
- 18 Orchid Ln
- 6 Snowy Egret Ct
- 10 Snowy Egret Ct
- 146 Stockbridge Dr
- 7 Bimini Dr
- 13 Bimini Dr
- 10 Leeward Dr
- 215 Sugar Mill Dr
- 101 Cambridge Dr
- 777 King George Blvd Unit 51
- 317 Lakeshore Dr
- 313 Lakeshore Dr
- 1 Sea Ln
- 127 Lakeshore Dr
- 1 Bluff Point
- 210 Pine Grove Dr
- 115 Companion Way
- 127 Pine Grove Dr