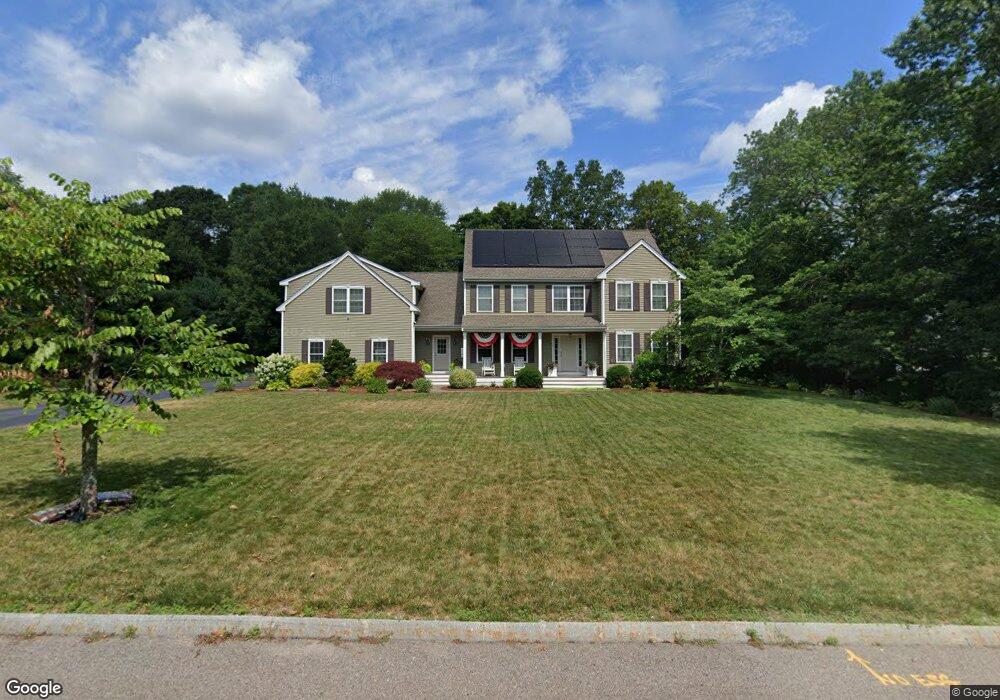
1 Mcnamara Way Foxboro, MA 02035
Estimated Value: $1,108,000 - $1,257,000
5
Beds
4
Baths
3,418
Sq Ft
$340/Sq Ft
Est. Value
About This Home
This home is located at 1 Mcnamara Way, Foxboro, MA 02035 and is currently estimated at $1,163,091, approximately $340 per square foot. 1 Mcnamara Way is a home with nearby schools including Foxborough High School, Foxborough Regional Charter School, and Hands-On-Montessori School.
Ownership History
Date
Name
Owned For
Owner Type
Purchase Details
Closed on
Jan 2, 2013
Sold by
Jbc Realty Llc
Bought by
Hoyt Jason M and Hoyt Sarah E
Current Estimated Value
Home Financials for this Owner
Home Financials are based on the most recent Mortgage that was taken out on this home.
Original Mortgage
$417,000
Outstanding Balance
$289,670
Interest Rate
3.35%
Mortgage Type
New Conventional
Estimated Equity
$873,421
Purchase Details
Closed on
Aug 24, 2012
Sold by
61-67 N High St Llc
Bought by
Jbc Realty Llc
Create a Home Valuation Report for This Property
The Home Valuation Report is an in-depth analysis detailing your home's value as well as a comparison with similar homes in the area
Home Values in the Area
Average Home Value in this Area
Purchase History
| Date | Buyer | Sale Price | Title Company |
|---|---|---|---|
| Hoyt Jason M | $607,450 | -- | |
| Jbc Realty Llc | -- | -- |
Source: Public Records
Mortgage History
| Date | Status | Borrower | Loan Amount |
|---|---|---|---|
| Open | Hoyt Jason M | $417,000 | |
| Closed | Hoyt Jason M | $77,250 |
Source: Public Records
Tax History Compared to Growth
Tax History
| Year | Tax Paid | Tax Assessment Tax Assessment Total Assessment is a certain percentage of the fair market value that is determined by local assessors to be the total taxable value of land and additions on the property. | Land | Improvement |
|---|---|---|---|---|
| 2025 | $11,768 | $890,200 | $262,600 | $627,600 |
| 2024 | $11,720 | $867,500 | $262,500 | $605,000 |
| 2023 | $11,151 | $784,700 | $250,100 | $534,600 |
| 2022 | $10,883 | $749,500 | $239,400 | $510,100 |
| 2021 | $10,604 | $719,400 | $217,700 | $501,700 |
| 2020 | $10,237 | $702,600 | $217,700 | $484,900 |
| 2019 | $9,820 | $668,000 | $207,300 | $460,700 |
| 2018 | $9,527 | $653,900 | $207,300 | $446,600 |
| 2017 | $9,180 | $610,400 | $193,700 | $416,700 |
| 2016 | $8,532 | $575,700 | $186,600 | $389,100 |
| 2015 | $8,607 | $566,600 | $157,600 | $409,000 |
| 2014 | $8,328 | $555,600 | $154,500 | $401,100 |
Source: Public Records
Map
Nearby Homes
- 356 Central St
- 12 Spring St
- 80 Mill St
- 11 W Belcher Rd Unit 2
- 450 West St
- 166 Chauncy St
- 406 South St
- 18 Winter St Unit E
- 14 Winter St Unit B
- 84 Cocasset St Unit A6
- 42 Angell St
- 44 Angell St Unit 44
- 619 N Main St
- 24 Mechanic St
- 14 Baker St
- 11 Orchard Place Unit 11
- 22 Pleasant St Unit C
- 82 Brook St
- 28 Court St
- 38 Court St