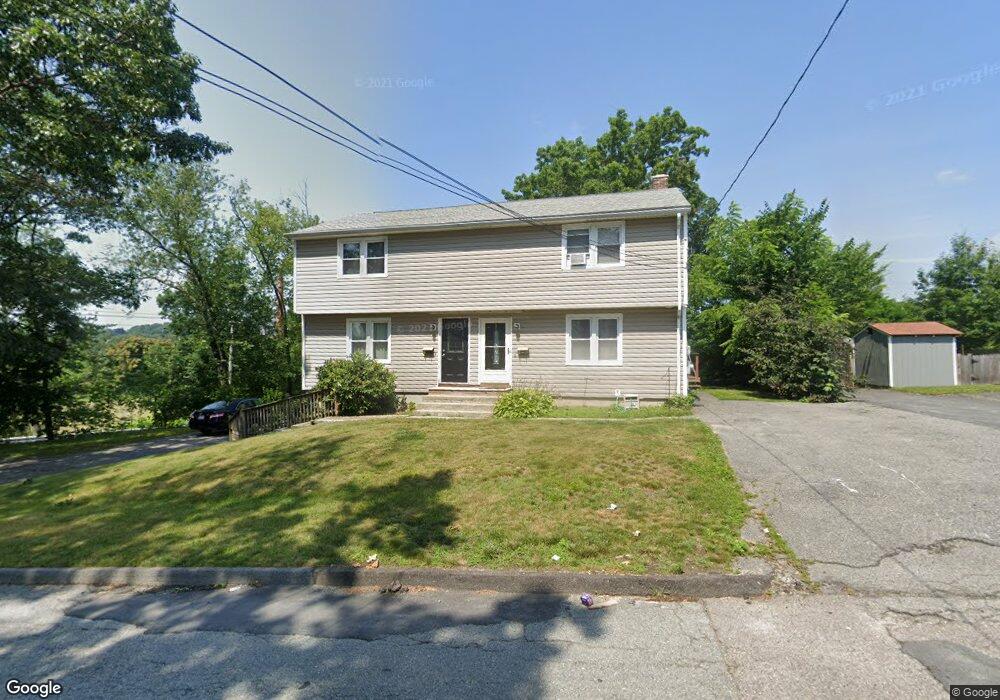
1 Mount Ave Worcester, MA 01606
Greendale NeighborhoodEstimated Value: $542,495 - $633,000
4
Beds
2
Baths
2,040
Sq Ft
$282/Sq Ft
Est. Value
About This Home
This home is located at 1 Mount Ave, Worcester, MA 01606 and is currently estimated at $575,498, approximately $282 per square foot. 1 Mount Ave is a home located in Worcester County with nearby schools including Norrback Avenue Elementary School, Jacob Hiatt Magnet School, and Chandler Magnet.
Ownership History
Date
Name
Owned For
Owner Type
Purchase Details
Closed on
Nov 14, 2019
Sold by
Panarelli Bridget
Bought by
Panarelli Sanservo-Channell C and Panarelli Francesca J
Current Estimated Value
Home Financials for this Owner
Home Financials are based on the most recent Mortgage that was taken out on this home.
Original Mortgage
$200,000
Outstanding Balance
$175,210
Interest Rate
3.5%
Mortgage Type
New Conventional
Estimated Equity
$400,288
Purchase Details
Closed on
May 20, 2002
Sold by
Department Of Housing & Urban Dev and Citiwest New Eng Inc
Bought by
Panarelli Bridget
Purchase Details
Closed on
Mar 23, 2001
Sold by
Senecal John R and Bank United
Bought by
Bank United
Purchase Details
Closed on
Aug 29, 1995
Sold by
Kullenberg Anna and Kullenberg Verner
Bought by
Senecal John and Senecal Concettina
Home Financials for this Owner
Home Financials are based on the most recent Mortgage that was taken out on this home.
Original Mortgage
$115,747
Interest Rate
7.32%
Mortgage Type
Purchase Money Mortgage
Create a Home Valuation Report for This Property
The Home Valuation Report is an in-depth analysis detailing your home's value as well as a comparison with similar homes in the area
Home Values in the Area
Average Home Value in this Area
Purchase History
| Date | Buyer | Sale Price | Title Company |
|---|---|---|---|
| Panarelli Sanservo-Channell C | $300,000 | -- | |
| Panarelli Sanservo-Channell C | $300,000 | -- | |
| Panarelli Bridget | $190,000 | -- | |
| Panarelli Bridget | $190,000 | -- | |
| Bank United | $134,717 | -- | |
| Bank United | $134,717 | -- | |
| Senecal John | $116,000 | -- | |
| Senecal John | $116,000 | -- |
Source: Public Records
Mortgage History
| Date | Status | Borrower | Loan Amount |
|---|---|---|---|
| Open | Panarelli Sanservo-Channell C | $200,000 | |
| Closed | Panarelli Sanservo-Channell C | $200,000 | |
| Previous Owner | Senecal John | $115,747 |
Source: Public Records
Tax History
| Year | Tax Paid | Tax Assessment Tax Assessment Total Assessment is a certain percentage of the fair market value that is determined by local assessors to be the total taxable value of land and additions on the property. | Land | Improvement |
|---|---|---|---|---|
| 2025 | $6,678 | $506,300 | $118,700 | $387,600 |
| 2024 | $6,491 | $472,100 | $118,700 | $353,400 |
| 2023 | $5,894 | $411,000 | $103,200 | $307,800 |
| 2022 | $6,055 | $398,100 | $82,600 | $315,500 |
| 2021 | $5,214 | $320,300 | $66,100 | $254,200 |
| 2020 | $4,502 | $264,800 | $66,100 | $198,700 |
| 2019 | $4,486 | $249,200 | $59,500 | $189,700 |
| 2018 | $4,612 | $243,900 | $59,500 | $184,400 |
| 2017 | $4,632 | $241,000 | $59,500 | $181,500 |
| 2016 | $4,483 | $217,500 | $43,700 | $173,800 |
| 2015 | $4,365 | $217,500 | $43,700 | $173,800 |
| 2014 | $4,250 | $217,500 | $43,700 | $173,800 |
Source: Public Records
Map
Nearby Homes
- 3 Mount Ave
- 2 Mount Ave
- 32 Brooks St
- 6 Mount Ave Unit B
- 2 Mount Ave Unit 2
- 40 Brooks St
- 40 Brooks St Unit B
- 4 Mount Ave
- 7 Mount Ave
- 6 Mount Ave
- 8 Mount Ave Unit A
- 48 Brooks St
- 9 Mount Ave
- 10 Mount Ave
- 12 Mount Ave
- 50 Brooks St Unit F
- 50 Brooks St Unit E
- 50 Brooks St Unit D
- 50 Brooks St Unit C
- 50 Brooks St Unit B
Your Personal Tour Guide
Ask me questions while you tour the home.