Estimated Value: $956,000 - $1,991,000
3
Beds
2
Baths
1,475
Sq Ft
$863/Sq Ft
Est. Value
About This Home
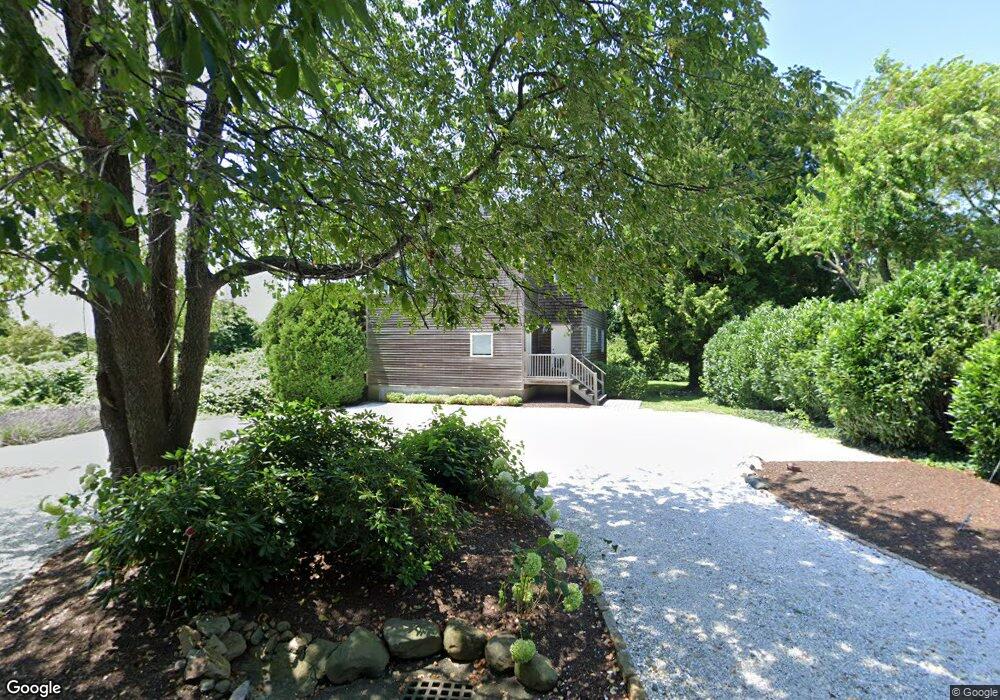
This home is located at 1 Net St, Jamestown, RI 02835 and is currently estimated at $1,273,236, approximately $863 per square foot. 1 Net St is a home located in Newport County with nearby schools including Melrose Avenue School and Lawn Avenue School.
Ownership History
Date
Name
Owned For
Owner Type
Purchase Details
Closed on
Mar 3, 2017
Sold by
Finkelstein Stan N and Benedict Jill A
Bought by
Jill A Benedict 2016 R and S N Finkelstein 2016 R
Current Estimated Value
Purchase Details
Closed on
Jan 12, 2000
Sold by
Mccann John P and Mccann Paula S
Bought by
Finkelstein Stan N and Benedict Jill A
Home Financials for this Owner
Home Financials are based on the most recent Mortgage that was taken out on this home.
Original Mortgage
$225,000
Interest Rate
7.79%
Create a Home Valuation Report for This Property
The Home Valuation Report is an in-depth analysis detailing your home's value as well as a comparison with similar homes in the area
Home Values in the Area
Average Home Value in this Area
Purchase History
| Date | Buyer | Sale Price | Title Company |
|---|---|---|---|
| Jill A Benedict 2016 R | -- | -- | |
| Finkelstein Stan N | $362,000 | -- |
Source: Public Records
Mortgage History
| Date | Status | Borrower | Loan Amount |
|---|---|---|---|
| Previous Owner | Finkelstein Stan N | $207,600 | |
| Previous Owner | Finkelstein Stan N | $225,000 |
Source: Public Records
Tax History
| Year | Tax Paid | Tax Assessment Tax Assessment Total Assessment is a certain percentage of the fair market value that is determined by local assessors to be the total taxable value of land and additions on the property. | Land | Improvement |
|---|---|---|---|---|
| 2025 | $4,678 | $829,400 | $287,900 | $541,500 |
| 2024 | $4,188 | $584,100 | $218,000 | $366,100 |
| 2023 | $4,156 | $595,400 | $218,000 | $377,400 |
| 2022 | $4,043 | $595,400 | $218,000 | $377,400 |
| 2021 | $4,556 | $550,300 | $246,100 | $304,200 |
| 2020 | $4,441 | $550,300 | $246,100 | $304,200 |
| 2019 | $4,430 | $550,300 | $246,100 | $304,200 |
| 2018 | $4,518 | $510,500 | $222,400 | $288,100 |
| 2017 | $4,421 | $510,500 | $222,400 | $288,100 |
| 2016 | $4,380 | $510,500 | $222,400 | $288,100 |
| 2015 | $4,520 | $514,800 | $260,100 | $254,700 |
| 2014 | $4,505 | $514,800 | $260,100 | $254,700 |
Source: Public Records
Map
Nearby Homes
- 44 Mast St
- 121 Seaside Dr
- 86 Spanker St
- 27 Marcello Dr
- 30 W Bay View Dr
- 127 Longfellow Rd
- 400 Schooner Ave
- 46 North Rd
- 63 Longfellow Rd
- 78 Narragansett Ave
- 77 Narragansett Ave Unit C
- 73 Conanicus Ave Unit 4
- 14 Clinton Ave
- 22 Cole St
- 0 Walcott Ave
- 104 Howland Ave
- 39 Walcott Ave
- 41 Walcott Ave
- 9 Parsley Ln
- 777 E Shore Rd
Your Personal Tour Guide
Ask me questions while you tour the home.