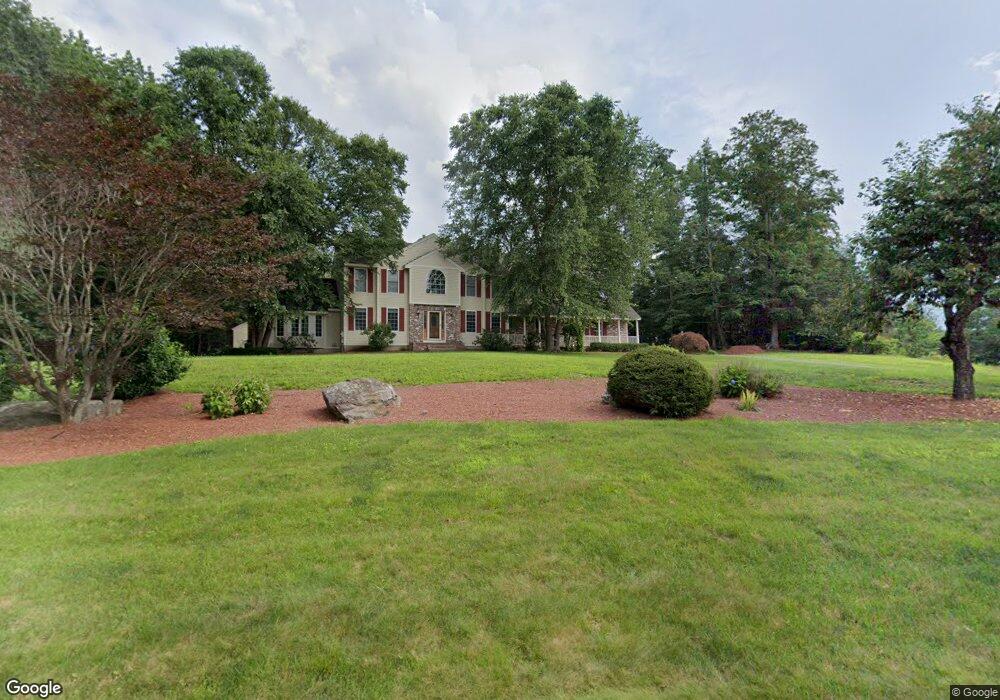
1 Newfound Rd Windham, NH 03087
Estimated Value: $1,146,000 - $1,432,000
4
Beds
3
Baths
3,893
Sq Ft
$325/Sq Ft
Est. Value
About This Home
This home is located at 1 Newfound Rd, Windham, NH 03087 and is currently estimated at $1,264,520, approximately $324 per square foot. 1 Newfound Rd is a home located in Rockingham County with nearby schools including Golden Brook Elementary School, Windham Middle School, and Windham High School.
Ownership History
Date
Name
Owned For
Owner Type
Purchase Details
Closed on
Jan 28, 2022
Sold by
Sullivan Eileen M
Bought by
Sullivan Eileen M and Duggan Daniel
Current Estimated Value
Home Financials for this Owner
Home Financials are based on the most recent Mortgage that was taken out on this home.
Original Mortgage
$123,918
Outstanding Balance
$114,422
Interest Rate
3.56%
Mortgage Type
Stand Alone Refi Refinance Of Original Loan
Estimated Equity
$1,150,098
Purchase Details
Closed on
Mar 31, 2015
Sold by
Sullivan Scott W
Bought by
Sullivan Eileen M
Home Financials for this Owner
Home Financials are based on the most recent Mortgage that was taken out on this home.
Original Mortgage
$250,000
Interest Rate
3.68%
Mortgage Type
New Conventional
Purchase Details
Closed on
Mar 23, 1998
Sold by
Coish Ronald
Bought by
Sullivan Scott W and Sullivan Eileen M
Home Financials for this Owner
Home Financials are based on the most recent Mortgage that was taken out on this home.
Original Mortgage
$293,200
Interest Rate
6.92%
Create a Home Valuation Report for This Property
The Home Valuation Report is an in-depth analysis detailing your home's value as well as a comparison with similar homes in the area
Home Values in the Area
Average Home Value in this Area
Purchase History
| Date | Buyer | Sale Price | Title Company |
|---|---|---|---|
| Sullivan Eileen M | -- | None Available | |
| Sullivan Eileen M | -- | None Available | |
| Sullivan Eileen M | -- | -- | |
| Sullivan Scott W | $366,500 | -- | |
| Sullivan Eileen M | -- | -- | |
| Sullivan Scott W | $366,500 | -- |
Source: Public Records
Mortgage History
| Date | Status | Borrower | Loan Amount |
|---|---|---|---|
| Open | Sullivan Eileen M | $123,918 | |
| Closed | Sullivan Eileen M | $123,918 | |
| Previous Owner | Sullivan Eileen M | $250,000 | |
| Previous Owner | Sullivan Scott W | $293,200 |
Source: Public Records
Tax History
| Year | Tax Paid | Tax Assessment Tax Assessment Total Assessment is a certain percentage of the fair market value that is determined by local assessors to be the total taxable value of land and additions on the property. | Land | Improvement |
|---|---|---|---|---|
| 2024 | $16,063 | $709,500 | $194,300 | $515,200 |
| 2023 | $15,183 | $709,500 | $194,300 | $515,200 |
| 2022 | $14,020 | $709,500 | $194,300 | $515,200 |
| 2021 | $13,211 | $709,500 | $194,300 | $515,200 |
| 2020 | $13,573 | $709,500 | $194,300 | $515,200 |
| 2019 | $13,077 | $579,900 | $177,700 | $402,200 |
| 2018 | $13,506 | $579,900 | $177,700 | $402,200 |
| 2017 | $11,714 | $579,900 | $177,700 | $402,200 |
| 2016 | $12,653 | $579,900 | $177,700 | $402,200 |
| 2015 | $12,778 | $588,300 | $177,700 | $410,600 |
| 2014 | $11,772 | $490,500 | $191,000 | $299,500 |
| 2013 | $11,668 | $494,400 | $191,000 | $303,400 |
Source: Public Records
Map
Nearby Homes