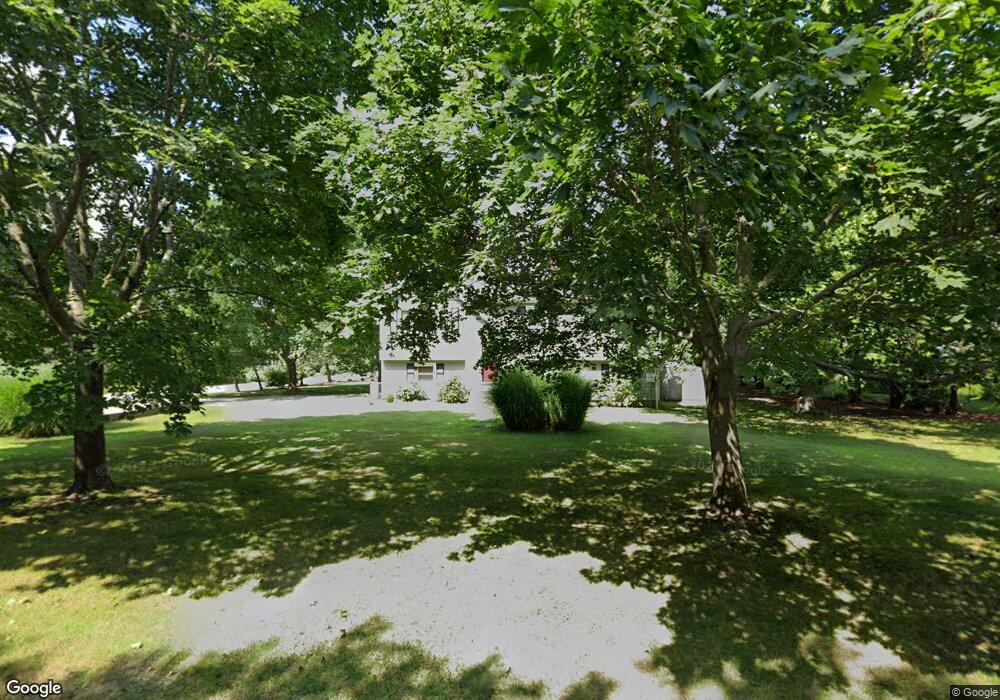
1 Norman Rd Jamestown, RI 02835
Jamestown Shores NeighborhoodEstimated Value: $765,000 - $833,000
3
Beds
2
Baths
1,008
Sq Ft
$796/Sq Ft
Est. Value
About This Home
This home is located at 1 Norman Rd, Jamestown, RI 02835 and is currently estimated at $802,022, approximately $795 per square foot. 1 Norman Rd is a home located in Newport County with nearby schools including Melrose Avenue School and Lawn Avenue School.
Ownership History
Date
Name
Owned For
Owner Type
Purchase Details
Closed on
Sep 7, 2018
Sold by
Murphy-Prior Emily J
Bought by
Murphy-Prior Emily J and Prior David D
Current Estimated Value
Purchase Details
Closed on
May 31, 2007
Sold by
Mcdevitt John and Mcdevitt Particia
Bought by
Chamberlain Emily
Home Financials for this Owner
Home Financials are based on the most recent Mortgage that was taken out on this home.
Original Mortgage
$380,000
Interest Rate
6.24%
Mortgage Type
Purchase Money Mortgage
Create a Home Valuation Report for This Property
The Home Valuation Report is an in-depth analysis detailing your home's value as well as a comparison with similar homes in the area
Home Values in the Area
Average Home Value in this Area
Purchase History
| Date | Buyer | Sale Price | Title Company |
|---|---|---|---|
| Murphy-Prior Emily J | -- | -- | |
| Chamberlain Emily | $480,000 | -- |
Source: Public Records
Mortgage History
| Date | Status | Borrower | Loan Amount |
|---|---|---|---|
| Previous Owner | Chamberlain Emily | $50,000 | |
| Previous Owner | Chamberlain Emily | $380,000 | |
| Previous Owner | Chamberlain Emily | $140,000 | |
| Previous Owner | Chamberlain Emily | $25,000 |
Source: Public Records
Tax History Compared to Growth
Tax History
| Year | Tax Paid | Tax Assessment Tax Assessment Total Assessment is a certain percentage of the fair market value that is determined by local assessors to be the total taxable value of land and additions on the property. | Land | Improvement |
|---|---|---|---|---|
| 2025 | $3,884 | $688,600 | $283,200 | $405,400 |
| 2024 | $3,738 | $521,300 | $214,500 | $306,800 |
| 2023 | $3,639 | $521,400 | $214,500 | $306,900 |
| 2022 | $3,467 | $510,600 | $214,500 | $296,100 |
| 2021 | $2,832 | $342,000 | $197,900 | $144,100 |
| 2020 | $2,760 | $342,000 | $197,900 | $144,100 |
| 2019 | $2,753 | $342,000 | $197,900 | $144,100 |
| 2018 | $2,924 | $330,400 | $179,000 | $151,400 |
| 2017 | $2,861 | $330,400 | $179,000 | $151,400 |
| 2016 | $2,835 | $330,400 | $179,000 | $151,400 |
| 2015 | $2,987 | $340,200 | $209,400 | $130,800 |
| 2014 | $2,977 | $340,200 | $209,400 | $130,800 |
Source: Public Records
Map
Nearby Homes
- 625 N Main Rd
- 31 Stanchion St
- 174 Seaside Dr
- 94 Spindrift St
- 121 Seaside Dr
- 21 Helm St
- 91 Carr Ln
- 398 Sampan Ave
- 10 Coulter St
- 280 W Reach Dr
- 10 Columbia Ln
- 65 Spring St
- 129 North Rd
- 16 Pennsylvania Ave
- 18 Collins Terrace
- 63 Pemberton Ave
- 48 Ocean Ave
- 46 North Rd
- 10 Highland Rd
- 73 Conanicus Ave Unit 4