1 Oakhurst Rd Hopkinton, MA 01748
Estimated Value: $1,095,000 - $1,360,000
4
Beds
4
Baths
2,650
Sq Ft
$469/Sq Ft
Est. Value
About This Home
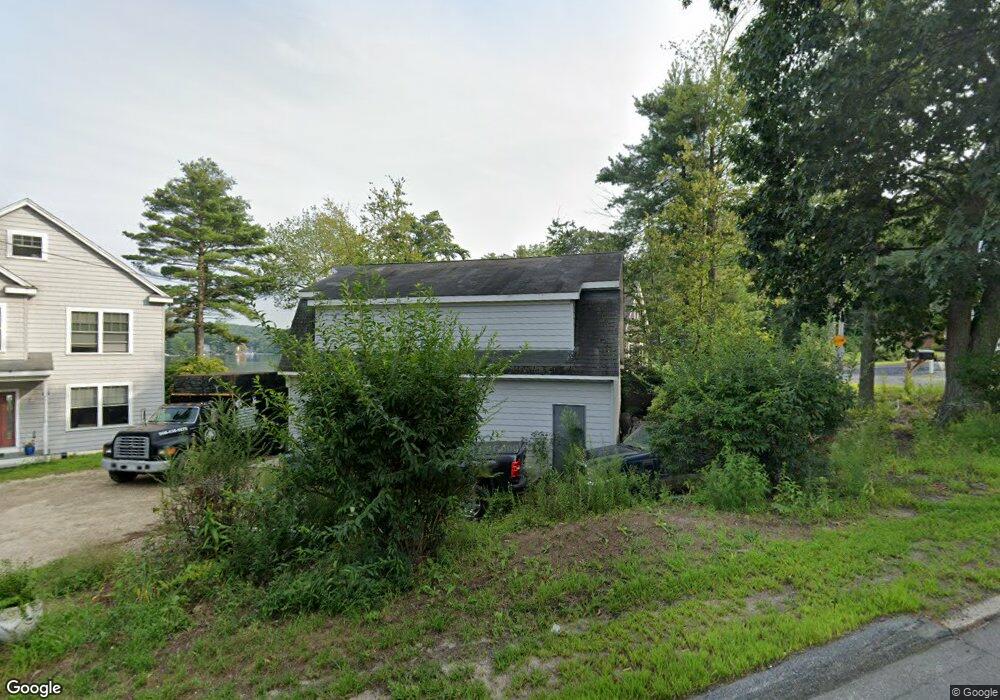
This home is located at 1 Oakhurst Rd, Hopkinton, MA 01748 and is currently estimated at $1,244,034, approximately $469 per square foot. 1 Oakhurst Rd is a home located in Middlesex County with nearby schools including Elmwood Elementary School, Hopkins Elementary School, and Hopkinton Middle School.
Ownership History
Date
Name
Owned For
Owner Type
Purchase Details
Closed on
Nov 4, 2020
Sold by
Oakhurst Prop Dev Llc
Bought by
Bonaceto Paul J and Bonaceto Nicole M
Current Estimated Value
Purchase Details
Closed on
Jun 30, 2020
Sold by
Powilatis Joyce S
Bought by
Oakhurst Prop Dev Llc
Home Financials for this Owner
Home Financials are based on the most recent Mortgage that was taken out on this home.
Original Mortgage
$570,000
Interest Rate
3.1%
Mortgage Type
New Conventional
Purchase Details
Closed on
Oct 5, 2007
Sold by
Stephansky Dale and Stephansky Marie M
Bought by
Powilatis Brian and Powilatis Stephansky-Powilatis J
Create a Home Valuation Report for This Property
The Home Valuation Report is an in-depth analysis detailing your home's value as well as a comparison with similar homes in the area
Home Values in the Area
Average Home Value in this Area
Purchase History
| Date | Buyer | Sale Price | Title Company |
|---|---|---|---|
| Bonaceto Paul J | $815,000 | None Available | |
| Oakhurst Prop Dev Llc | $320,000 | None Available | |
| Powilatis Brian | $150,000 | -- |
Source: Public Records
Mortgage History
| Date | Status | Borrower | Loan Amount |
|---|---|---|---|
| Previous Owner | Oakhurst Prop Dev Llc | $570,000 |
Source: Public Records
Tax History Compared to Growth
Tax History
| Year | Tax Paid | Tax Assessment Tax Assessment Total Assessment is a certain percentage of the fair market value that is determined by local assessors to be the total taxable value of land and additions on the property. | Land | Improvement |
|---|---|---|---|---|
| 2025 | $15,745 | $1,110,400 | $385,500 | $724,900 |
| 2024 | $14,961 | $1,024,000 | $367,100 | $656,900 |
| 2023 | $14,578 | $922,100 | $322,100 | $600,000 |
| 2022 | $14,292 | $839,200 | $292,900 | $546,300 |
| 2021 | $8,438 | $494,000 | $284,000 | $210,000 |
| 2020 | $5,714 | $339,700 | $277,200 | $62,500 |
| 2019 | $5,525 | $321,800 | $267,000 | $54,800 |
| 2018 | $5,210 | $308,300 | $254,000 | $54,300 |
| 2017 | $5,020 | $298,800 | $246,600 | $52,200 |
| 2016 | $4,981 | $292,500 | $241,800 | $50,700 |
| 2015 | $4,725 | $263,100 | $216,400 | $46,700 |
Source: Public Records
Map
Nearby Homes