1 Oakleaf Ct Algonquin, IL 60102
Estimated Value: $533,000 - $590,498
About This Home
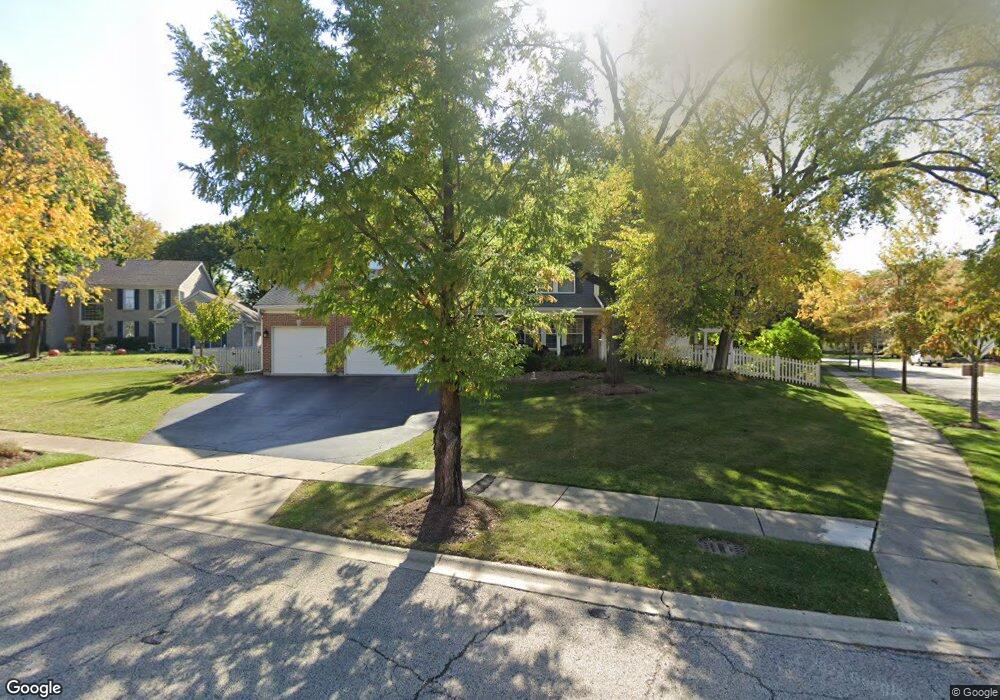
This home is located at 1 Oakleaf Ct, Algonquin, IL 60102 and is currently estimated at $552,875, approximately $156 per square foot. 1 Oakleaf Ct is a home located in McHenry County with nearby schools including Westfield Community School, Lincoln Prairie Elementary School, and Harry D Jacobs High School.
Ownership History
We collect this data history from publicly available records. To have your information removed, we recommend requesting removal directly through your county’s website.
Purchase Details
Purchase Details
Home Financials for this Owner
Home Financials are based on the most recent Mortgage that was taken out on this home.Purchase Details
Home Financials for this Owner
Home Financials are based on the most recent Mortgage that was taken out on this home.Purchase History
We collect this data history from publicly available records. To have your information removed, we recommend requesting removal directly through your county’s website.
| Date | Buyer | Sale Price | Title Company |
|---|---|---|---|
| -- | None Listed On Document | ||
| $334,000 | Ticor | ||
| $283,000 | First American |
Mortgage History
We collect this data history from publicly available records. To have your information removed, we recommend requesting removal directly through your county’s website.
| Date | Status | Borrower | Loan Amount |
|---|---|---|---|
| Previous Owner | $265,000 | ||
| Previous Owner | $142,900 |
Tax History
We collect this data history from publicly available records. To have your information removed, we recommend requesting removal directly through your county’s website.
| Year | Tax Paid | Tax Assessment Tax Assessment Total Assessment is a certain percentage of the fair market value that is determined by local assessors to be the total taxable value of land and additions on the property. | Land | Improvement |
|---|---|---|---|---|
| 2024 | $10,484 | $150,025 | $28,308 | $121,717 |
| 2023 | $9,893 | $134,179 | $25,318 | $108,861 |
| 2022 | $11,312 | $137,900 | $28,355 | $109,545 |
| 2021 | $10,867 | $128,470 | $26,416 | $102,054 |
| 2020 | $10,589 | $123,922 | $25,481 | $98,441 |
| 2019 | $10,340 | $118,608 | $24,388 | $94,220 |
| 2018 | $10,538 | $116,562 | $23,967 | $92,595 |
| 2017 | $10,337 | $109,808 | $22,578 | $87,230 |
| 2016 | $10,199 | $102,990 | $21,176 | $81,814 |
| 2013 | -- | $85,311 | $19,755 | $65,556 |
Map
- 155 Salford Dr
- 113 Pheasant Trail
- 190 Lake Dr S
- 100 Village Creek Dr Unit 17A
- 106 Village Creek Dr Unit 17D
- 110 Village Creek Dr Unit 110
- 295 Winchester Dr
- 217 Wander Way
- 1600 Huntington Dr N
- 275 Farmhill Dr
- 1 Grandview Ct
- 1431 Essex St
- LOT 3 Blackhawk Dr
- 46 Kelsey Ct
- 1141 Stonegate Rd
- 811 Westbury Dr
- 1141 Millcreek Ln
- 750 Majestic Dr
- 1112 Spruce St
- 731 Roaring Brook Ln
- 3 Oakleaf Ct
- 35 S Oakleaf Rd
- 10 S Oakleaf Rd
- 2 Oakleaf Ct
- 8 Salford Ct
- 45 S Oakleaf Rd
- 5 Oakleaf Ct
- 20 S Oakleaf Rd
- 6 Oakleaf Ct
- 6 Salford Ct
- 2101 W Algonquin Rd
- 4 Oakleaf Ct
- 30 S Oakleaf Rd Unit 2
- 5 Salford Ct
- 55 S Oakleaf Rd
- 40 S Oakleaf Rd
- 4 Salford Ct Unit 2
- 3 Salford Ct
- 50 S Oakleaf Rd
- 65 S Oakleaf Rd Unit 2
Ask me questions while you tour the home.