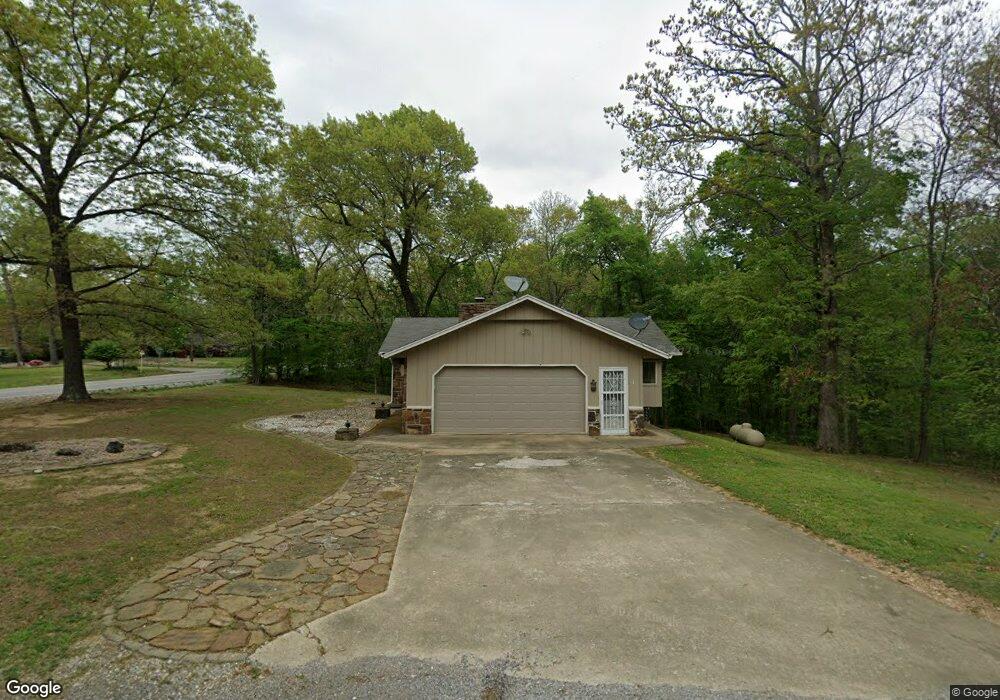
1 Park Ln Bella Vista, AR 72715
Estimated Value: $276,000 - $359,000
2
Beds
3
Baths
2,208
Sq Ft
$151/Sq Ft
Est. Value
About This Home
This home is located at 1 Park Ln, Bella Vista, AR 72715 and is currently estimated at $333,253, approximately $150 per square foot. 1 Park Ln is a home located in Benton County with nearby schools including Cooper Elementary School, Old High Middle School, and Washington Junior High School.
Ownership History
Date
Name
Owned For
Owner Type
Purchase Details
Closed on
Jul 17, 2025
Sold by
Meraz Julie and Meraz Jonathan R
Bought by
Jonathan R Meraz And Julie A Meraz Trust and Meraz
Current Estimated Value
Purchase Details
Closed on
Mar 5, 2015
Sold by
Katherine D Kitterlin Revocable Trust
Bought by
Vanhecke Jason W and Vanhecke Van Hecke
Purchase Details
Closed on
Sep 11, 2014
Sold by
Carlson Mark S and Carlson Marianne T
Bought by
Carlson Mark S and The Mark S Carlson Trust
Purchase Details
Closed on
Oct 19, 2006
Sold by
Phillips Rose Mary
Bought by
Carlson Mark S and Carlson Marianne T
Home Financials for this Owner
Home Financials are based on the most recent Mortgage that was taken out on this home.
Original Mortgage
$110,000
Interest Rate
6.37%
Mortgage Type
Purchase Money Mortgage
Purchase Details
Closed on
Oct 25, 1997
Bought by
Dod 10-25-1997
Purchase Details
Closed on
Jan 28, 1980
Bought by
Phillips
Create a Home Valuation Report for This Property
The Home Valuation Report is an in-depth analysis detailing your home's value as well as a comparison with similar homes in the area
Home Values in the Area
Average Home Value in this Area
Purchase History
| Date | Buyer | Sale Price | Title Company |
|---|---|---|---|
| Jonathan R Meraz And Julie A Meraz Trust | -- | None Listed On Document | |
| Vanhecke Jason W | $5,000 | -- | |
| Carlson Mark S | -- | None Available | |
| Carlson Mark S | $160,000 | None Available | |
| Dod 10-25-1997 | -- | -- | |
| Phillips | $76,000 | -- |
Source: Public Records
Mortgage History
| Date | Status | Borrower | Loan Amount |
|---|---|---|---|
| Previous Owner | Carlson Mark S | $110,000 |
Source: Public Records
Tax History Compared to Growth
Tax History
| Year | Tax Paid | Tax Assessment Tax Assessment Total Assessment is a certain percentage of the fair market value that is determined by local assessors to be the total taxable value of land and additions on the property. | Land | Improvement |
|---|---|---|---|---|
| 2025 | $1,685 | $57,576 | $1,600 | $55,976 |
| 2024 | $1,668 | $57,576 | $1,600 | $55,976 |
| 2023 | $1,668 | $37,910 | $800 | $37,110 |
| 2022 | $1,347 | $37,910 | $800 | $37,110 |
| 2021 | $1,343 | $37,910 | $800 | $37,110 |
| 2020 | $1,275 | $25,910 | $600 | $25,310 |
| 2019 | $1,275 | $25,910 | $600 | $25,310 |
| 2018 | $1,300 | $25,910 | $600 | $25,310 |
| 2017 | $1,236 | $25,910 | $600 | $25,310 |
| 2016 | $1,236 | $25,910 | $600 | $25,310 |
| 2015 | $1,486 | $24,650 | $1,000 | $23,650 |
| 2014 | $1,136 | $24,650 | $1,000 | $23,650 |
Source: Public Records
Map
Nearby Homes
- 0 Minton Ln
- 3 Sutton Ln
- 2 Ottery Ln
- Lot 4 Chapel Ln
- 17 Hollow Way Dr
- 3 Hollow Way Dr
- 7 Bradford Dr
- 0 Nottingham Dr
- 0 Munster Dr
- 2 Devon Ln
- Lot 32 Nottingham Dr
- 15 Oakham Cir
- 6 Finger Dr
- 29 Knighton Dr
- 6 Tisbury Ln
- 22 Hatcher Dr
- 5 Ashton Cir
- 9 Wilton Ln
- Lot 23 Block 2 Armitage Dr
- 0 Armitage Dr Unit 1312875