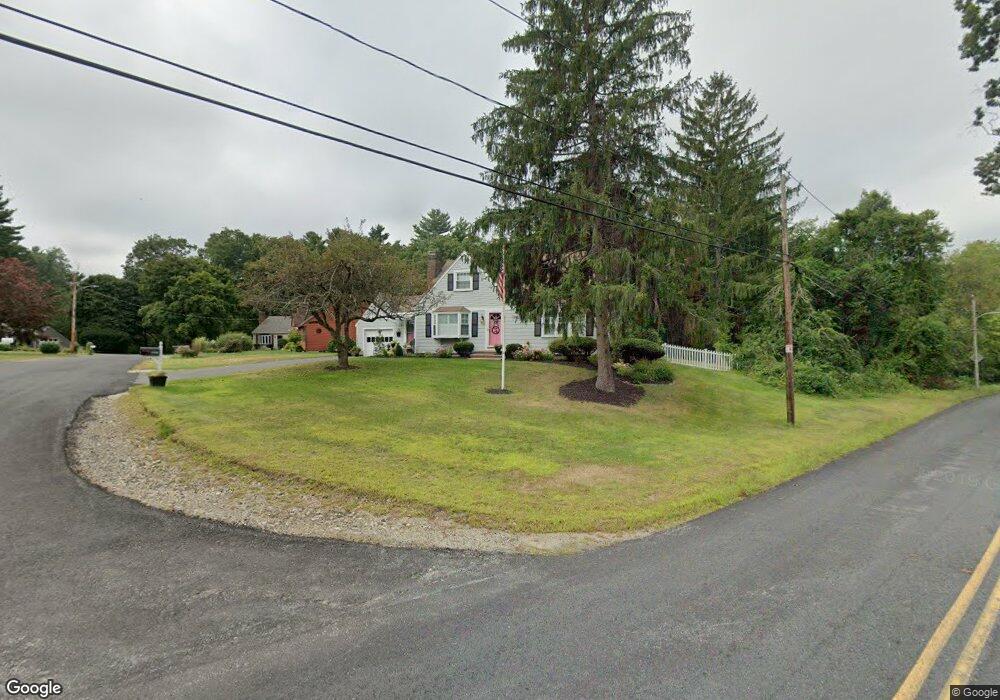
1 Phillips Ave Georgetown, MA 01833
Estimated Value: $651,000 - $829,000
4
Beds
2
Baths
2,071
Sq Ft
$345/Sq Ft
Est. Value
About This Home
This home is located at 1 Phillips Ave, Georgetown, MA 01833 and is currently estimated at $714,286, approximately $344 per square foot. 1 Phillips Ave is a home located in Essex County with nearby schools including Perley Elementary School, Penn Brook School, and Georgetown High School.
Ownership History
Date
Name
Owned For
Owner Type
Purchase Details
Closed on
Mar 11, 2011
Sold by
Rotondo Robert J and Corl Susan S
Bought by
Rotondo Robert J and Corl Susan S
Current Estimated Value
Purchase Details
Closed on
Jun 30, 2010
Sold by
Clark Justin R and Clark Barbara C
Bought by
Rotondo Robert J and Corl Susan S
Home Financials for this Owner
Home Financials are based on the most recent Mortgage that was taken out on this home.
Original Mortgage
$258,675
Interest Rate
4.88%
Mortgage Type
Purchase Money Mortgage
Purchase Details
Closed on
Sep 21, 2006
Sold by
Jonasch Rt and Jonasch John G
Bought by
Clark Justin R
Home Financials for this Owner
Home Financials are based on the most recent Mortgage that was taken out on this home.
Original Mortgage
$243,750
Interest Rate
6.59%
Mortgage Type
Purchase Money Mortgage
Create a Home Valuation Report for This Property
The Home Valuation Report is an in-depth analysis detailing your home's value as well as a comparison with similar homes in the area
Home Values in the Area
Average Home Value in this Area
Purchase History
| Date | Buyer | Sale Price | Title Company |
|---|---|---|---|
| Rotondo Robert J | -- | -- | |
| Rotondo Robert J | $344,900 | -- | |
| Clark Justin R | $325,000 | -- |
Source: Public Records
Mortgage History
| Date | Status | Borrower | Loan Amount |
|---|---|---|---|
| Open | Clark Justin R | $250,000 | |
| Previous Owner | Clark Justin R | $258,675 | |
| Previous Owner | Clark Justin R | $308,700 | |
| Previous Owner | Clark Justin R | $243,750 |
Source: Public Records
Tax History
| Year | Tax Paid | Tax Assessment Tax Assessment Total Assessment is a certain percentage of the fair market value that is determined by local assessors to be the total taxable value of land and additions on the property. | Land | Improvement |
|---|---|---|---|---|
| 2025 | $6,911 | $624,900 | $256,400 | $368,500 |
| 2024 | $6,029 | $480,400 | $176,900 | $303,500 |
| 2023 | $6,236 | $480,400 | $176,900 | $303,500 |
| 2022 | $6,439 | $457,300 | $153,800 | $303,500 |
| 2021 | $5,852 | $368,300 | $153,800 | $214,500 |
| 2020 | $5,863 | $368,300 | $153,800 | $214,500 |
| 2019 | $5,764 | $365,300 | $150,800 | $214,500 |
| 2018 | $5,801 | $365,300 | $150,800 | $214,500 |
| 2017 | $5,672 | $349,900 | $150,800 | $199,100 |
| 2016 | $5,337 | $336,300 | $150,800 | $185,500 |
| 2015 | $5,219 | $325,600 | $150,800 | $174,800 |
| 2014 | $4,575 | $325,600 | $150,800 | $174,800 |
Source: Public Records
Map
Nearby Homes
- 459 North St
- 11 Main St
- 13 Main St
- 66 Parish Rd Unit 8
- 8 Molloy Rd
- 18 Forest St
- 32 Summer St
- 12 Warren St
- 22 Tenney St
- 5 Oak Terrace
- 34 Central St
- 64 W Main St
- 11 Central St
- 6 Lenway Rd
- 30 Christa Dr
- 33 Downfall Rd
- 38 Pearson Dr
- 52 Andover St
- 55 Pearson Dr Unit 9 - ALDER
- 55 Pearson Dr Unit 8-Dogwood
Your Personal Tour Guide
Ask me questions while you tour the home.