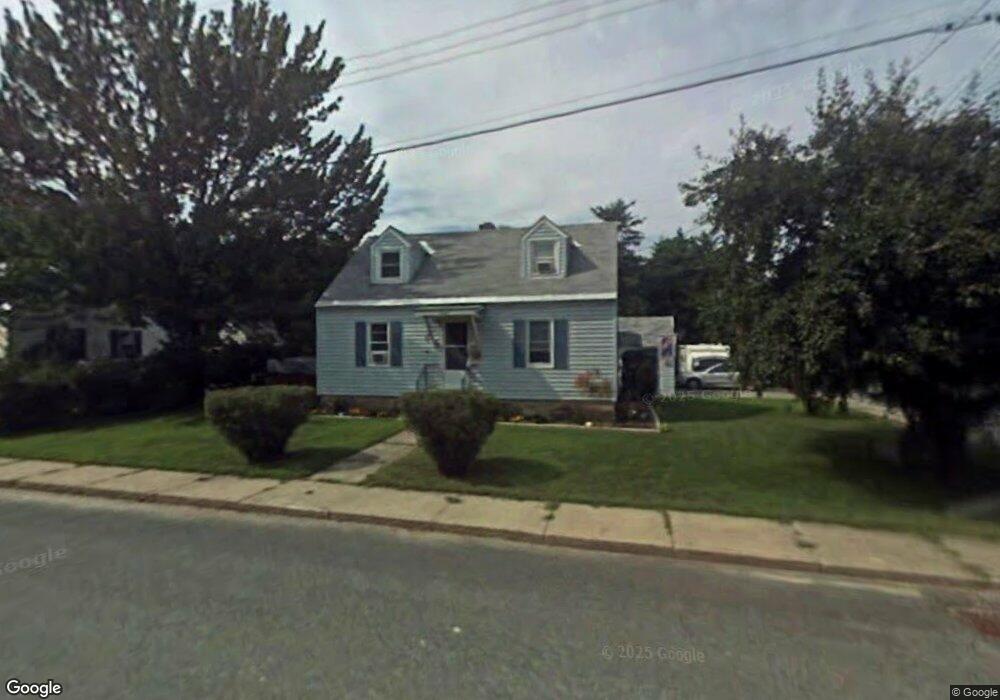
1 Pine Grove St Claremont, NH 03743
Maple Avenue District NeighborhoodEstimated Value: $233,000 - $250,000
2
Beds
1
Bath
963
Sq Ft
$251/Sq Ft
Est. Value
About This Home
This home is located at 1 Pine Grove St, Claremont, NH 03743 and is currently estimated at $241,458, approximately $250 per square foot. 1 Pine Grove St is a home located in Sullivan County with nearby schools including Maple Avenue School, Claremont Middle School, and Stevens High School.
Ownership History
Date
Name
Owned For
Owner Type
Purchase Details
Closed on
Feb 26, 2018
Sold by
Leblanc Kevin J and Leblanc Lori
Bought by
Leblanc Kevin J and Leblanc Lori
Current Estimated Value
Purchase Details
Closed on
Oct 14, 2015
Sold by
Richardson Amy K
Bought by
Burns Donna
Purchase Details
Closed on
Jun 28, 2000
Sold by
Flanders Roy F
Bought by
Blanchard Alfred W and Blanchard Beverly R
Create a Home Valuation Report for This Property
The Home Valuation Report is an in-depth analysis detailing your home's value as well as a comparison with similar homes in the area
Home Values in the Area
Average Home Value in this Area
Purchase History
| Date | Buyer | Sale Price | Title Company |
|---|---|---|---|
| Leblanc Kevin J | -- | -- | |
| Burns Donna | -- | -- | |
| Blanchard Alfred W | $6,000 | -- |
Source: Public Records
Mortgage History
| Date | Status | Borrower | Loan Amount |
|---|---|---|---|
| Previous Owner | Blanchard Alfred W | $104,000 |
Source: Public Records
Tax History Compared to Growth
Tax History
| Year | Tax Paid | Tax Assessment Tax Assessment Total Assessment is a certain percentage of the fair market value that is determined by local assessors to be the total taxable value of land and additions on the property. | Land | Improvement |
|---|---|---|---|---|
| 2024 | $5,753 | $196,600 | $34,200 | $162,400 |
| 2023 | $5,465 | $196,600 | $34,200 | $162,400 |
| 2022 | $4,130 | $99,100 | $15,600 | $83,500 |
| 2021 | $4,061 | $99,100 | $15,600 | $83,500 |
| 2020 | $4,060 | $99,700 | $15,600 | $84,100 |
| 2019 | $4,380 | $108,800 | $15,600 | $93,200 |
| 2018 | $3,594 | $85,400 | $15,600 | $69,800 |
| 2017 | $3,643 | $85,400 | $15,600 | $69,800 |
| 2016 | $3,640 | $85,400 | $15,600 | $69,800 |
| 2015 | $3,542 | $85,400 | $15,600 | $69,800 |
| 2014 | $3,530 | $85,400 | $15,600 | $69,800 |
| 2013 | $4,220 | $116,400 | $16,800 | $99,600 |
Source: Public Records
Map
Nearby Homes