
Seller's Agent in 2017
Jill Austin
BHHS Fox & Roach
(732) 213-1063
11 Total Sales

Estimated Value: $589,000 - $635,000
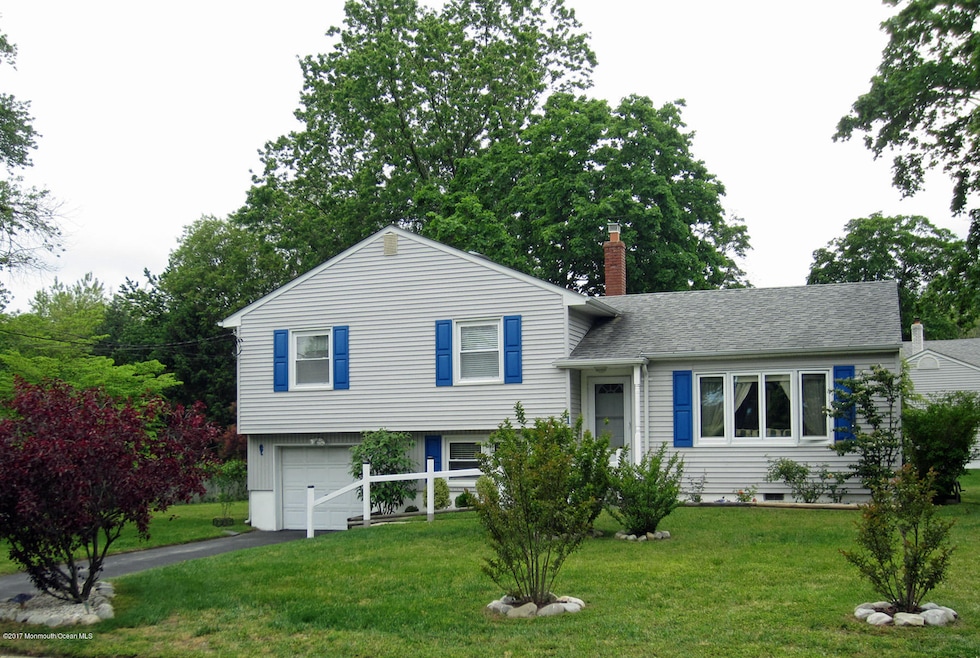
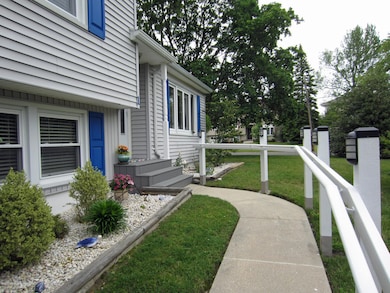
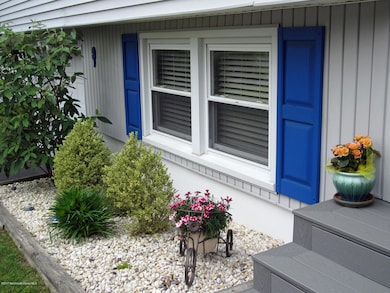
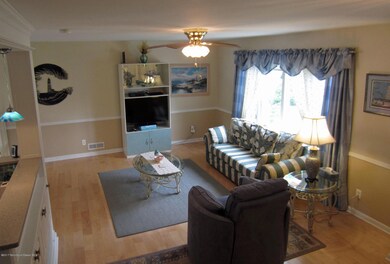
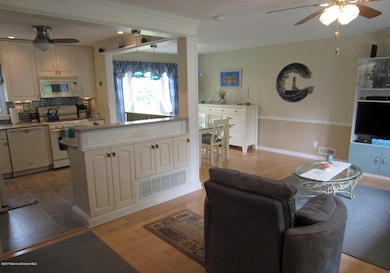
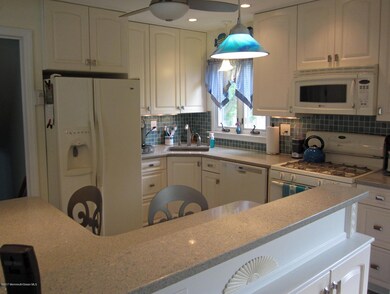
Since purchasing the owner updated home. The kitchen was gutted, walls removed and opened to dining and living room. The kitchen features 42” cabinets, premium quartz countertops, buffet with storage, newer appliances, recessed & pendant lights. The bright living/dining rooms have light wide-plank maple floors and molding. The replaced front stoop is low maintenance composite material. The home sits on an oversized corner lot with beautiful landscaping, specimen trees and newer shed. Upstairs are 3 freshly painted and re-carpeted bedrooms with unexposed hardwood floors and updated bath. The lower level offers a newly carpeted family room, toilet room, laundry, access to the garage, yard and patio. Energy efficient with transferable solar system, one year old furnace and upgraded electric. Private neighborhood accessible to Shark River Park! Convenient location with great proximity to the Parkway and Routes 195,33 & 66.
Last Agent to Sell the Property
Berkshire Hathaway HomeServices Fox & Roach - Holmdel License #0121263 Listed on: 05/26/2017
Last Buyer's Agent
Nancy Leavitt
Keller Williams Realty East Monmouth
| Date | Buyer | Sale Price | Title Company |
|---|---|---|---|
| Bing Sarah C | $50,000 | Servicelink | |
| Bing Sarah C | $330,000 | -- | |
| Lipski Susan M | $333,000 | -- |
| Date | Status | Borrower | Loan Amount |
|---|---|---|---|
| Open | Bing Sarah C | $100,000 | |
| Previous Owner | Bing Sarah C | $324,022 | |
| Previous Owner | Lipski Susan M | $170,000 |
| Date | Event | Price | List to Sale | Price per Sq Ft |
|---|---|---|---|---|
| 09/29/2017 09/29/17 | Sold | $330,000 | -- | $219 / Sq Ft |
| Year | Tax Paid | Tax Assessment Tax Assessment Total Assessment is a certain percentage of the fair market value that is determined by local assessors to be the total taxable value of land and additions on the property. | Land | Improvement |
|---|---|---|---|---|
| 2025 | $7,890 | $562,800 | $336,000 | $226,800 |
| 2024 | $7,370 | $450,600 | $261,400 | $189,200 |
| 2023 | $7,370 | $408,100 | $223,300 | $184,800 |
| 2022 | $7,212 | $360,600 | $182,300 | $178,300 |
| 2021 | $7,079 | $341,300 | $180,300 | $161,000 |
| 2020 | $7,180 | $339,000 | $194,300 | $144,700 |
| 2019 | $7,079 | $330,000 | $194,300 | $135,700 |
| 2018 | $5,733 | $264,200 | $161,000 | $103,200 |
| 2017 | $5,794 | $256,500 | $161,000 | $95,500 |
| 2016 | $5,889 | $260,000 | $166,000 | $94,000 |
| 2015 | $5,739 | $257,700 | $166,000 | $91,700 |
| 2014 | $6,120 | $225,900 | $133,600 | $92,300 |
Seller's Agent in 2017
Jill Austin
BHHS Fox & Roach
(732) 213-1063
11 Total Sales
N
Buyer's Agent in 2017
Nancy Leavitt
Keller Williams Realty East Monmouth
Source: MOREMLS (Monmouth Ocean Regional REALTORS®)
MLS Number: 21720777
APN: 35-04215-0000-00003
Disclaimer: Certain information contained herein is derived from information provided by parties other than Homes.com. All information provided is deemed reliable, but is not guaranteed to be accurate and should be independently verified.
![]() IDX information is provided exclusively for personal, non-commercial use, and may not be used for any purpose other than to identify prospective properties consumers may be interested in purchasing.
IDX information is provided exclusively for personal, non-commercial use, and may not be used for any purpose other than to identify prospective properties consumers may be interested in purchasing.
Information is deemed reliable but not guaranteed.
Ask me questions while you tour the home.