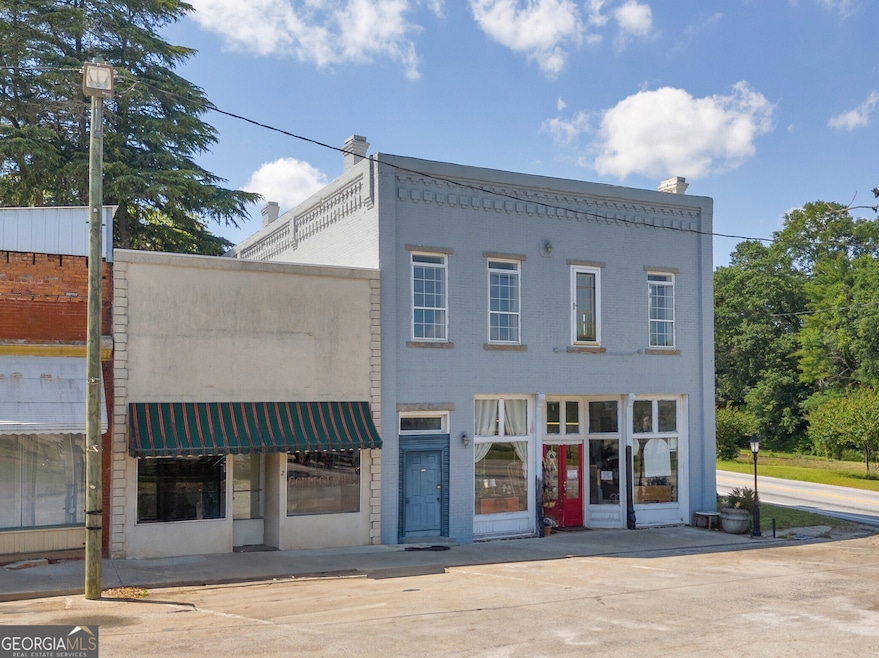
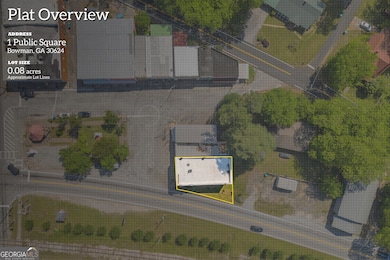
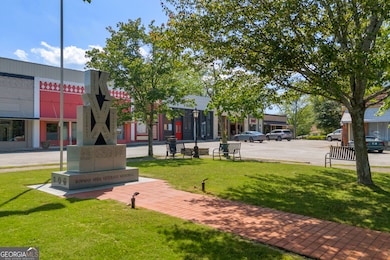

1 Public Square Bowman, GA 30624
Estimated payment $1,120/month
Highlights
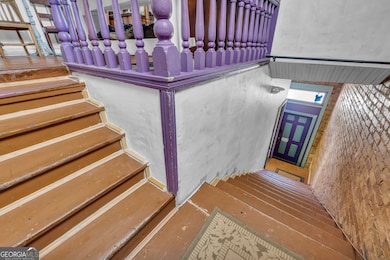
- Wood Flooring
- No HOA
- Central Heating and Cooling System
- High Ceiling
- Double Vanity
- Ceiling Fan
About This Home
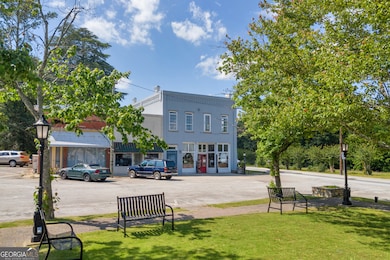
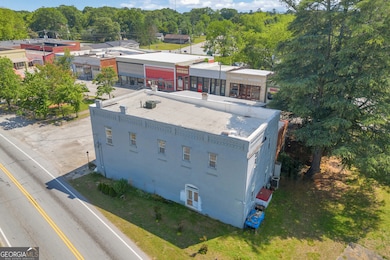
Historic Landmark in the heart of Bowman. Own a piece of history with this carefully preserved building, displaying timeless architecture along with modern functionality. This unique spot offers street level commercial space with large display windows and ample visibility in all directions. Ideal for retail, cafe/restaurant, gallery or office use, to name just a few of the options. Some features include original wood floors, exposed brick walls and soaring ceilings. Upstairs is a loft apartment with vintage details, such as gorgeous heart pine floors, original wood ceilings, along with tons of natural daylight and the best view of the charming town square. This blend of old-world charm and contemporary conveniences provide the perfect live-work atmosphere or steady income on both levels. NOTE**Zoned Commercial - has residential space upstairs ** Investors & Owner-Occupants, call today!
Property Details
Home Type
- Condominium
Est. Annual Taxes
- $705
Year Built
- Built in 1910
Parking
- Over 1 Space Per Unit
Home Design
- Loft
- Mixed Use
- Brick Exterior Construction
Interior Spaces
- 3,696 Sq Ft Home
- 2-Story Property
- High Ceiling
- Ceiling Fan
- Wood Flooring
- Crawl Space
Kitchen
- Oven or Range
- Dishwasher
Bedrooms and Bathrooms
- 1 Bedroom
- Double Vanity
Laundry
- Laundry on upper level
- Dryer
- Washer
Schools
- Elbert Co Primary/Elem Elementary School
- Elbert County Middle School
- Elbert County High School
Utilities
- Central Heating and Cooling System
- High Speed Internet
- Cable TV Available
Community Details
- No Home Owners Association
Map
Home Values in the Area
Average Home Value in this Area
Tax History
| Year | Tax Paid | Tax Assessment Tax Assessment Total Assessment is a certain percentage of the fair market value that is determined by local assessors to be the total taxable value of land and additions on the property. | Land | Improvement |
|---|---|---|---|---|
| 2024 | $651 | $36,471 | $3,607 | $32,864 |
| 2023 | $651 | $36,471 | $3,607 | $32,864 |
| 2022 | $402 | $26,324 | $3,066 | $23,258 |
| 2021 | $405 | $26,324 | $3,066 | $23,258 |
| 2020 | $741 | $26,865 | $3,607 | $23,258 |
| 2019 | $765 | $26,865 | $3,607 | $23,258 |
| 2018 | $782 | $26,865 | $3,607 | $23,258 |
| 2017 | $1,066 | $33,944 | $3,607 | $30,337 |
| 2016 | $996 | $33,944 | $3,607 | $30,337 |
| 2015 | -- | $33,944 | $3,607 | $30,337 |
| 2014 | -- | $33,944 | $3,607 | $30,337 |
| 2013 | -- | $33,944 | $3,607 | $30,337 |
Property History
| Date | Event | Price | Change | Sq Ft Price |
|---|---|---|---|---|
| 05/11/2025 05/11/25 | For Sale | $199,900 | -- | $54 / Sq Ft |
Purchase History
| Date | Type | Sale Price | Title Company |
|---|---|---|---|
| Warranty Deed | $87,500 | -- | |
| Deed | $85,000 | -- | |
| Deed | -- | -- | |
| Deed | $85,000 | -- | |
| Deed | $32,000 | -- | |
| Deed | -- | -- |
Mortgage History
| Date | Status | Loan Amount | Loan Type |
|---|---|---|---|
| Open | $78,750 | No Value Available | |
| Previous Owner | $97,000 | No Value Available |
Source: Georgia MLS
MLS Number: 10519923
APN: B02-096
Disclaimer: Certain information contained herein is derived from information provided by parties other than Homes.com. All information provided is deemed reliable, but is not guaranteed to be accurate and should be independently verified.
![]() The data relating to real estate for sale on this web site comes in part from the Broker Reciprocity Program of Georgia MLS. Real estate listings held by brokerage firms other than Redfin are marked with the Broker Reciprocity logo and detailed information about them includes the name of the listing brokers. Information deemed reliable but not guaranteed. Copyright 2025 Georgia MLS. All rights reserved.
The data relating to real estate for sale on this web site comes in part from the Broker Reciprocity Program of Georgia MLS. Real estate listings held by brokerage firms other than Redfin are marked with the Broker Reciprocity logo and detailed information about them includes the name of the listing brokers. Information deemed reliable but not guaranteed. Copyright 2025 Georgia MLS. All rights reserved.
- 84 Bowers St
- 126 S Segars St
- 375 S Broad St
- 40 Carey St
- 444 E Railroad St
- 0 Five Forks Rd Unit 10481959
- 611 Winston Drive Extension
- 2117 Bennett Rd
- 9509 E Highway 172
- 2732 Zero O Dr
- 0 Quill Rd Unit 7598009
- 0 Quill Rd Unit 10543809
- 2655 Jess Guest Rd
- 2784 Stanley Maxwell Rd
- 0 Dusty Rd Unit 10443624
- 2145 Dusty Rd
- 0 Fork Creek Rd Unit 10492034
- 124 Mcgarity Rd
- 3611 Old Elbert Rd
- 0A Deep Creek Rd
