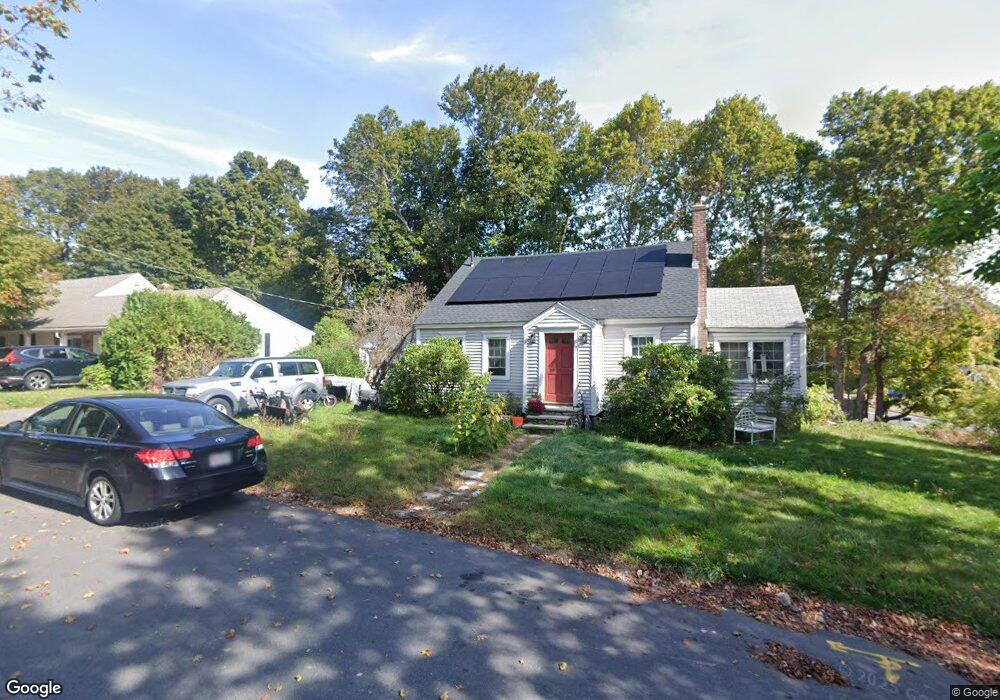
1 Ripley Rd Westminster, MA 01473
Estimated Value: $390,389 - $472,000
3
Beds
2
Baths
1,612
Sq Ft
$274/Sq Ft
Est. Value
About This Home
This home is located at 1 Ripley Rd, Westminster, MA 01473 and is currently estimated at $442,347, approximately $274 per square foot. 1 Ripley Rd is a home located in Worcester County with nearby schools including Oakmont Regional High School and Wachusett Hills Christian School.
Ownership History
Date
Name
Owned For
Owner Type
Purchase Details
Closed on
Dec 28, 2016
Sold by
Murphy Daniel J
Bought by
Daley James J
Current Estimated Value
Home Financials for this Owner
Home Financials are based on the most recent Mortgage that was taken out on this home.
Original Mortgage
$102,800
Outstanding Balance
$84,278
Interest Rate
3.94%
Mortgage Type
New Conventional
Estimated Equity
$358,069
Purchase Details
Closed on
Jan 28, 2011
Sold by
Daley 3Rd James J
Bought by
Murphy Daniel J
Home Financials for this Owner
Home Financials are based on the most recent Mortgage that was taken out on this home.
Original Mortgage
$113,600
Interest Rate
4.83%
Mortgage Type
Purchase Money Mortgage
Create a Home Valuation Report for This Property
The Home Valuation Report is an in-depth analysis detailing your home's value as well as a comparison with similar homes in the area
Home Values in the Area
Average Home Value in this Area
Purchase History
| Date | Buyer | Sale Price | Title Company |
|---|---|---|---|
| Daley James J | $128,500 | -- | |
| Murphy Daniel J | $142,000 | -- |
Source: Public Records
Mortgage History
| Date | Status | Borrower | Loan Amount |
|---|---|---|---|
| Open | Daley James J | $102,800 | |
| Previous Owner | Murphy Daniel J | $113,600 | |
| Previous Owner | Murphy Daniel J | $15,000 | |
| Previous Owner | Murphy Daniel J | $58,000 |
Source: Public Records
Tax History
| Year | Tax Paid | Tax Assessment Tax Assessment Total Assessment is a certain percentage of the fair market value that is determined by local assessors to be the total taxable value of land and additions on the property. | Land | Improvement |
|---|---|---|---|---|
| 2025 | $3,482 | $283,100 | $109,300 | $173,800 |
| 2024 | $3,353 | $273,500 | $109,300 | $164,200 |
| 2023 | $3,546 | $271,500 | $102,200 | $169,300 |
| 2022 | $3,384 | $214,200 | $88,900 | $125,300 |
| 2021 | $3,074 | $192,000 | $73,500 | $118,500 |
| 2020 | $3,133 | $178,500 | $66,800 | $111,700 |
| 2019 | $3,046 | $166,900 | $55,200 | $111,700 |
| 2018 | $2,625 | $156,000 | $55,200 | $100,800 |
| 2017 | $2,527 | $153,800 | $55,200 | $98,600 |
| 2016 | $2,693 | $143,400 | $46,000 | $97,400 |
| 2015 | $2,717 | $143,400 | $46,000 | $97,400 |
| 2014 | $2,722 | $143,400 | $46,000 | $97,400 |
Source: Public Records
Map
Nearby Homes
- 9 Knower Rd
- 38 Knower Rd
- 2 Seaver St
- 17 Leominster St
- 29 Dawley Rd
- 0 Worcester Rd Unit 73326124
- 100A W Main St
- 6 Shady Ave
- 21 Davis Rd
- 97 Worcester Rd
- 0 Syd Smith Rd Unit 73395578
- Lot 3 Sunset Rd
- Lot 5 Sunset Rd
- 0 Syd Smith Rd (Rear)
- 0 Syd Smith Rd Map 71 Lot 4-2
- 0
- 29 Sunset Rd
- 25 Sunset Rd
- 0 Minott Rd
- Lot 6 Shady Ave
Your Personal Tour Guide
Ask me questions while you tour the home.