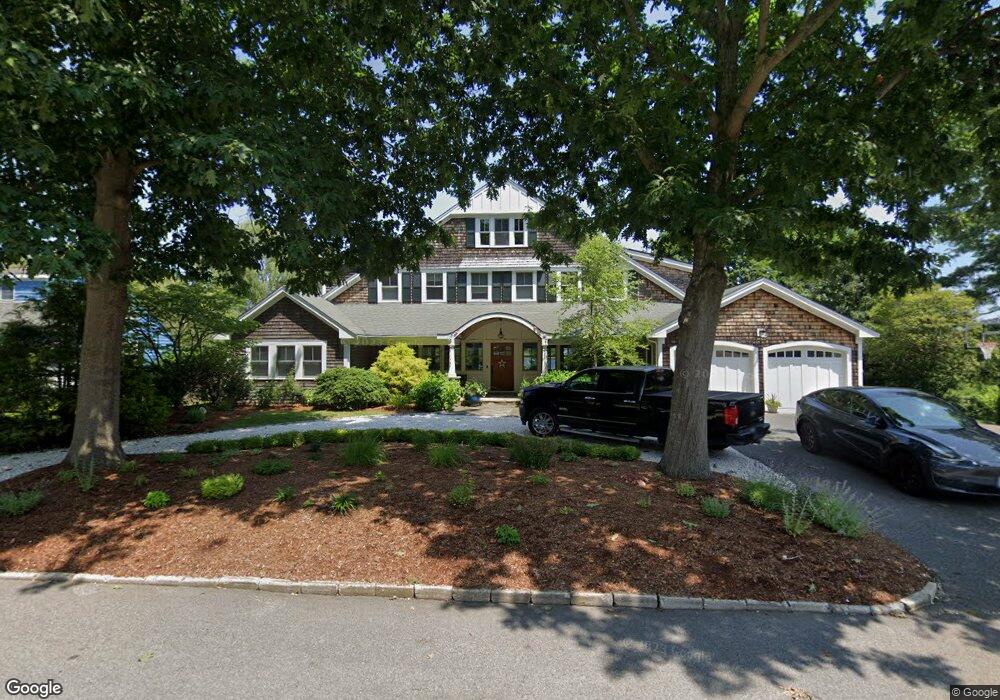
1 Riverside Dr Barrington, RI 02806
North Barrington NeighborhoodEstimated Value: $2,046,000 - $2,957,000
6
Beds
4
Baths
4,411
Sq Ft
$550/Sq Ft
Est. Value
About This Home
This home is located at 1 Riverside Dr, Barrington, RI 02806 and is currently estimated at $2,424,009, approximately $549 per square foot. 1 Riverside Dr is a home located in Bristol County with nearby schools including Barrington High School, Barrington Christian Academy, and St. Andrews School.
Ownership History
Date
Name
Owned For
Owner Type
Purchase Details
Closed on
Aug 30, 2011
Sold by
Holland Lee G and Holland Heidi V
Bought by
Holland Heidi V and Duffy Susan J
Current Estimated Value
Purchase Details
Closed on
Oct 29, 2003
Sold by
Carrick Gerald and Carrick Chase
Bought by
Holland Lee and Holland Heidi
Purchase Details
Closed on
Jun 24, 1997
Sold by
Mabey Joyce H
Bought by
Carrick Gerald W and Carrick Chase W
Create a Home Valuation Report for This Property
The Home Valuation Report is an in-depth analysis detailing your home's value as well as a comparison with similar homes in the area
Home Values in the Area
Average Home Value in this Area
Purchase History
| Date | Buyer | Sale Price | Title Company |
|---|---|---|---|
| Holland Heidi V | $1,250,000 | -- | |
| Holland Lee | $785,000 | -- | |
| Carrick Gerald W | $355,000 | -- |
Source: Public Records
Mortgage History
| Date | Status | Borrower | Loan Amount |
|---|---|---|---|
| Previous Owner | Carrick Gerald W | $494,900 | |
| Previous Owner | Carrick Gerald W | $500,000 |
Source: Public Records
Tax History
| Year | Tax Paid | Tax Assessment Tax Assessment Total Assessment is a certain percentage of the fair market value that is determined by local assessors to be the total taxable value of land and additions on the property. | Land | Improvement |
|---|---|---|---|---|
| 2025 | $36,172 | $2,358,000 | $1,179,000 | $1,179,000 |
| 2024 | $34,781 | $2,358,000 | $1,179,000 | $1,179,000 |
| 2023 | $31,770 | $1,565,000 | $795,000 | $770,000 |
| 2022 | $30,752 | $1,565,000 | $795,000 | $770,000 |
| 2021 | $29,874 | $1,560,000 | $795,000 | $765,000 |
| 2020 | $28,654 | $1,371,000 | $707,000 | $664,000 |
| 2019 | $27,557 | $1,371,000 | $707,000 | $664,000 |
| 2018 | $26,735 | $1,371,000 | $707,000 | $664,000 |
| 2017 | $27,048 | $1,352,400 | $768,500 | $583,900 |
| 2016 | $24,952 | $1,352,400 | $768,500 | $583,900 |
| 2015 | $24,681 | $1,352,400 | $768,500 | $583,900 |
| 2014 | $25,737 | $1,406,400 | $734,100 | $672,300 |
Source: Public Records
Map
Nearby Homes
Your Personal Tour Guide
Ask me questions while you tour the home.