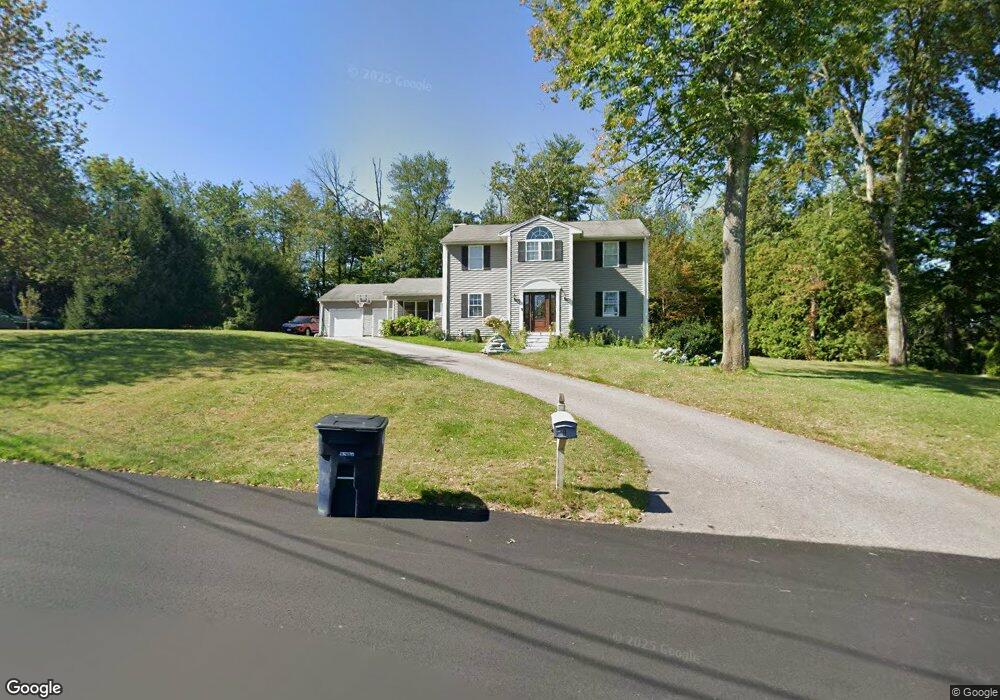
1 Rosecliff Dr Nashua, NH 03062
Southwest Nashua NeighborhoodEstimated Value: $675,937 - $779,000
4
Beds
4
Baths
2,346
Sq Ft
$314/Sq Ft
Est. Value
About This Home
This home is located at 1 Rosecliff Dr, Nashua, NH 03062 and is currently estimated at $737,234, approximately $314 per square foot. 1 Rosecliff Dr is a home located in Hillsborough County with nearby schools including Bicentennial Elementary School, Fairgrounds Middle School, and Nashua High School South.
Ownership History
Date
Name
Owned For
Owner Type
Purchase Details
Closed on
Aug 30, 2021
Sold by
Parker David L
Bought by
Lively Christopher J and Lively Rachel A
Current Estimated Value
Home Financials for this Owner
Home Financials are based on the most recent Mortgage that was taken out on this home.
Original Mortgage
$424,000
Outstanding Balance
$384,966
Interest Rate
2.8%
Mortgage Type
Purchase Money Mortgage
Estimated Equity
$352,268
Purchase Details
Closed on
Mar 21, 2000
Sold by
Hammar Brian A and Hammar Mary Elizabeth
Bought by
Parker David C and Parker Jennifer R
Home Financials for this Owner
Home Financials are based on the most recent Mortgage that was taken out on this home.
Original Mortgage
$180,000
Interest Rate
8.24%
Mortgage Type
Purchase Money Mortgage
Create a Home Valuation Report for This Property
The Home Valuation Report is an in-depth analysis detailing your home's value as well as a comparison with similar homes in the area
Home Values in the Area
Average Home Value in this Area
Purchase History
| Date | Buyer | Sale Price | Title Company |
|---|---|---|---|
| Lively Christopher J | $530,000 | None Available | |
| Parker David C | $225,000 | -- |
Source: Public Records
Mortgage History
| Date | Status | Borrower | Loan Amount |
|---|---|---|---|
| Open | Lively Christopher J | $424,000 | |
| Previous Owner | Parker David C | $317,640 | |
| Previous Owner | Parker David C | $331,846 | |
| Previous Owner | Parker David C | $60,000 | |
| Previous Owner | Parker David C | $180,000 |
Source: Public Records
Tax History Compared to Growth
Tax History
| Year | Tax Paid | Tax Assessment Tax Assessment Total Assessment is a certain percentage of the fair market value that is determined by local assessors to be the total taxable value of land and additions on the property. | Land | Improvement |
|---|---|---|---|---|
| 2024 | $9,542 | $600,100 | $171,900 | $428,200 |
| 2023 | $9,027 | $495,200 | $137,500 | $357,700 |
| 2022 | $8,948 | $495,200 | $137,500 | $357,700 |
| 2021 | $8,004 | $344,700 | $110,000 | $234,700 |
| 2020 | $7,744 | $342,500 | $110,000 | $232,500 |
| 2019 | $7,453 | $342,500 | $110,000 | $232,500 |
| 2018 | $7,264 | $342,500 | $110,000 | $232,500 |
| 2017 | $8,209 | $318,300 | $99,100 | $219,200 |
| 2016 | $7,980 | $318,300 | $99,100 | $219,200 |
| 2015 | $7,808 | $318,300 | $99,100 | $219,200 |
| 2014 | $7,655 | $318,300 | $99,100 | $219,200 |
Source: Public Records
Map
Nearby Homes
- 285 E Dunstable Rd
- 10 Lamb Rd
- 84 Hawthorne Village Rd Unit U414
- 16 Mountain Laurels Dr Unit 402
- 51 Legacy Dr
- 10 Mountain Laurels Dr Unit 606
- 29 Dickens St
- 125 Lille Rd
- 5 Appaloosa Place
- 19 Georgetown Dr
- 32 Cadogan Way Unit UZ257
- 57 Wethersfield Rd
- 31 Tenby Dr
- 8 Hikers Ln
- 7 Doucet Ave
- 4 Hikers Ln
- 65 Wilderness Dr
- 58 Wilderness Dr
- 50 Wilderness Dr
- 4 Wilderness Dr