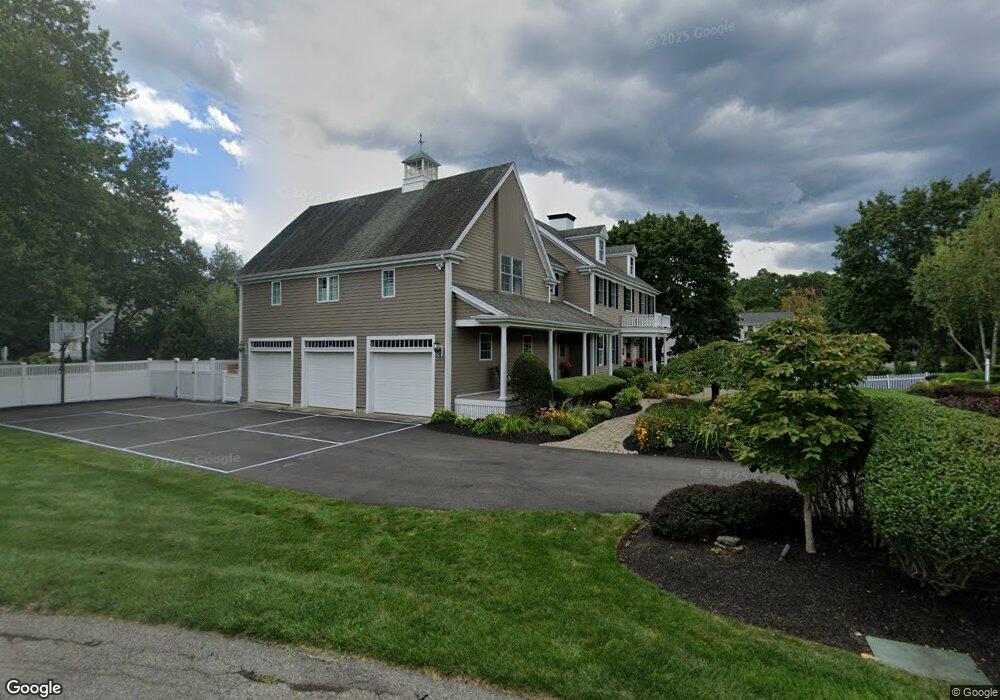
1 Rosewood Ln Hingham, MA 02043
Estimated Value: $1,895,000 - $2,398,736
4
Beds
4
Baths
4,168
Sq Ft
$514/Sq Ft
Est. Value
About This Home
This home is located at 1 Rosewood Ln, Hingham, MA 02043 and is currently estimated at $2,143,184, approximately $514 per square foot. 1 Rosewood Ln is a home located in Plymouth County with nearby schools including Plymouth River Elementary School, South Shore Conservatory of Music Preschool, and St. Paul Elementary School.
Ownership History
Date
Name
Owned For
Owner Type
Purchase Details
Closed on
Feb 8, 2010
Sold by
Diane E Nielsen T and Nielsen Diane E
Bought by
Nielsen Steven A and Nielsen Diane E
Current Estimated Value
Home Financials for this Owner
Home Financials are based on the most recent Mortgage that was taken out on this home.
Original Mortgage
$496,000
Outstanding Balance
$328,597
Interest Rate
5.05%
Mortgage Type
Purchase Money Mortgage
Estimated Equity
$1,814,587
Purchase Details
Closed on
Apr 15, 2008
Sold by
Nielsen Diane E
Bought by
E Nielsen T and Nielsen Diane E
Home Financials for this Owner
Home Financials are based on the most recent Mortgage that was taken out on this home.
Original Mortgage
$523,000
Interest Rate
6.3%
Purchase Details
Closed on
Sep 20, 2001
Sold by
Rd Matthews Constr Co
Bought by
Nielsen Steven A and Nielsen Diane
Create a Home Valuation Report for This Property
The Home Valuation Report is an in-depth analysis detailing your home's value as well as a comparison with similar homes in the area
Home Values in the Area
Average Home Value in this Area
Purchase History
| Date | Buyer | Sale Price | Title Company |
|---|---|---|---|
| Nielsen Steven A | -- | -- | |
| E Nielsen T | -- | -- | |
| Nielsen Diane E | -- | -- | |
| Nielsen Steven A | $863,250 | -- |
Source: Public Records
Mortgage History
| Date | Status | Borrower | Loan Amount |
|---|---|---|---|
| Open | Nielsen Steven A | $496,000 | |
| Previous Owner | Nielsen Steven A | $523,000 | |
| Previous Owner | Nielsen Steven A | $177,000 | |
| Previous Owner | Nielsen Steven A | $165,000 |
Source: Public Records
Tax History Compared to Growth
Tax History
| Year | Tax Paid | Tax Assessment Tax Assessment Total Assessment is a certain percentage of the fair market value that is determined by local assessors to be the total taxable value of land and additions on the property. | Land | Improvement |
|---|---|---|---|---|
| 2025 | $25,020 | $2,340,500 | $612,900 | $1,727,600 |
| 2024 | $23,803 | $2,193,800 | $612,900 | $1,580,900 |
| 2023 | $20,702 | $2,070,200 | $612,900 | $1,457,300 |
| 2022 | $19,022 | $1,645,500 | $510,600 | $1,134,900 |
| 2021 | $18,630 | $1,578,800 | $531,900 | $1,046,900 |
| 2020 | $18,204 | $1,578,800 | $531,900 | $1,046,900 |
| 2019 | $17,860 | $1,512,300 | $531,900 | $980,400 |
| 2018 | $6,589 | $1,451,700 | $531,900 | $919,800 |
| 2017 | $16,686 | $1,362,100 | $531,900 | $830,200 |
| 2016 | $16,694 | $1,336,600 | $506,400 | $830,200 |
| 2015 | $16,437 | $1,311,800 | $481,600 | $830,200 |
Source: Public Records
Map
Nearby Homes
- 10 Cranberry Ln
- 8 Cranberry Ln
- 12 Cranberry Ln
- 4 Rosewood Ln
- 5 Rosewood Ln
- 2 Rosewood Ln
- 4 Cranberry Ln
- 7 Cranberry Ln
- 5 Cranberry Ln
- 27 French St
- 29 French St
- 31 French St
- 25 French St
- 14 Cranberry Ln
- 3 Cranberry Ln
- 11 Cranberry Ln
- 33 French St
- 21 French St
- 10 Ridgewood Crossing
- 12 Ridgewood Crossing