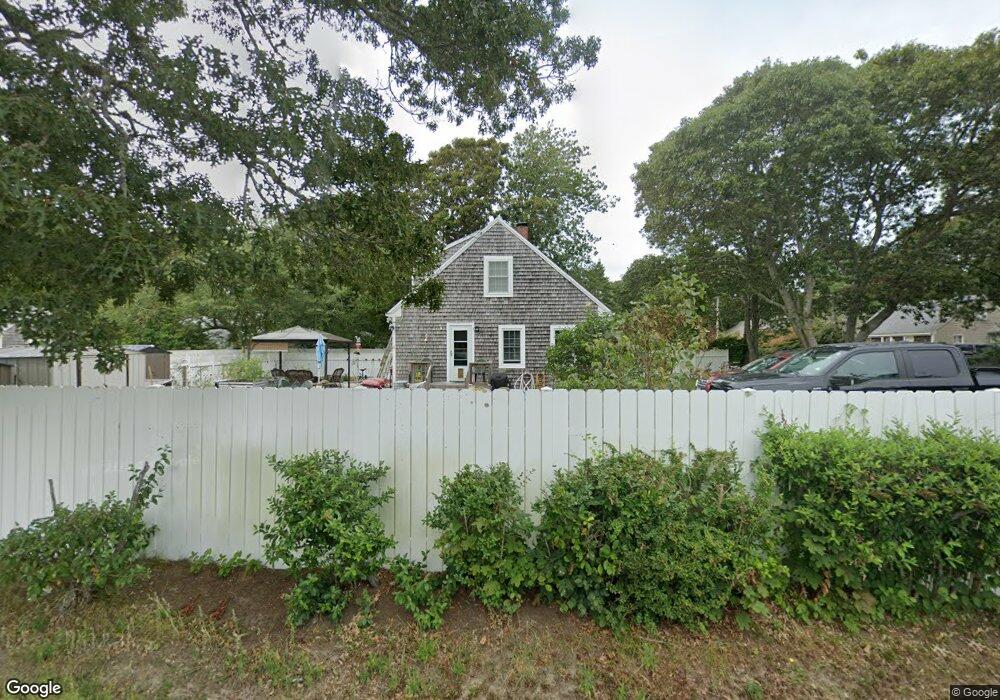
1 Samoset Rd South Yarmouth, MA 02664
Estimated Value: $544,820 - $582,000
2
Beds
1
Bath
1,001
Sq Ft
$563/Sq Ft
Est. Value
About This Home
This home is located at 1 Samoset Rd, South Yarmouth, MA 02664 and is currently estimated at $563,705, approximately $563 per square foot. 1 Samoset Rd is a home located in Barnstable County with nearby schools including Dennis-Yarmouth Regional High School and St. Pius X. School.
Ownership History
Date
Name
Owned For
Owner Type
Purchase Details
Closed on
Sep 14, 2001
Sold by
Regan Brian J and Regan Dorine
Bought by
Fairbairn Brian and Fairbairn Margaret A
Current Estimated Value
Home Financials for this Owner
Home Financials are based on the most recent Mortgage that was taken out on this home.
Original Mortgage
$117,000
Outstanding Balance
$45,624
Interest Rate
6.99%
Mortgage Type
Purchase Money Mortgage
Estimated Equity
$518,081
Create a Home Valuation Report for This Property
The Home Valuation Report is an in-depth analysis detailing your home's value as well as a comparison with similar homes in the area
Home Values in the Area
Average Home Value in this Area
Purchase History
| Date | Buyer | Sale Price | Title Company |
|---|---|---|---|
| Fairbairn Brian | $130,000 | -- |
Source: Public Records
Mortgage History
| Date | Status | Borrower | Loan Amount |
|---|---|---|---|
| Open | Fairbairn Brian | $117,000 | |
| Previous Owner | Fairbairn Brian | $90,500 |
Source: Public Records
Tax History Compared to Growth
Tax History
| Year | Tax Paid | Tax Assessment Tax Assessment Total Assessment is a certain percentage of the fair market value that is determined by local assessors to be the total taxable value of land and additions on the property. | Land | Improvement |
|---|---|---|---|---|
| 2025 | $3,127 | $441,700 | $160,500 | $281,200 |
| 2024 | $2,860 | $387,600 | $135,700 | $251,900 |
| 2023 | $2,810 | $346,500 | $117,400 | $229,100 |
| 2022 | $2,562 | $279,100 | $106,800 | $172,300 |
| 2021 | $2,527 | $264,300 | $106,800 | $157,500 |
| 2020 | $2,450 | $245,000 | $106,800 | $138,200 |
| 2019 | $7,632 | $227,900 | $106,800 | $121,100 |
| 2018 | $2,183 | $212,100 | $91,000 | $121,100 |
| 2017 | $2,085 | $208,100 | $87,000 | $121,100 |
| 2016 | $1,998 | $200,200 | $79,100 | $121,100 |
| 2015 | $1,908 | $190,000 | $79,100 | $110,900 |
Source: Public Records
Map
Nearby Homes