Estimated Value: $1,765,000 - $1,947,000
3
Beds
3
Baths
2,467
Sq Ft
$750/Sq Ft
Est. Value
About This Home
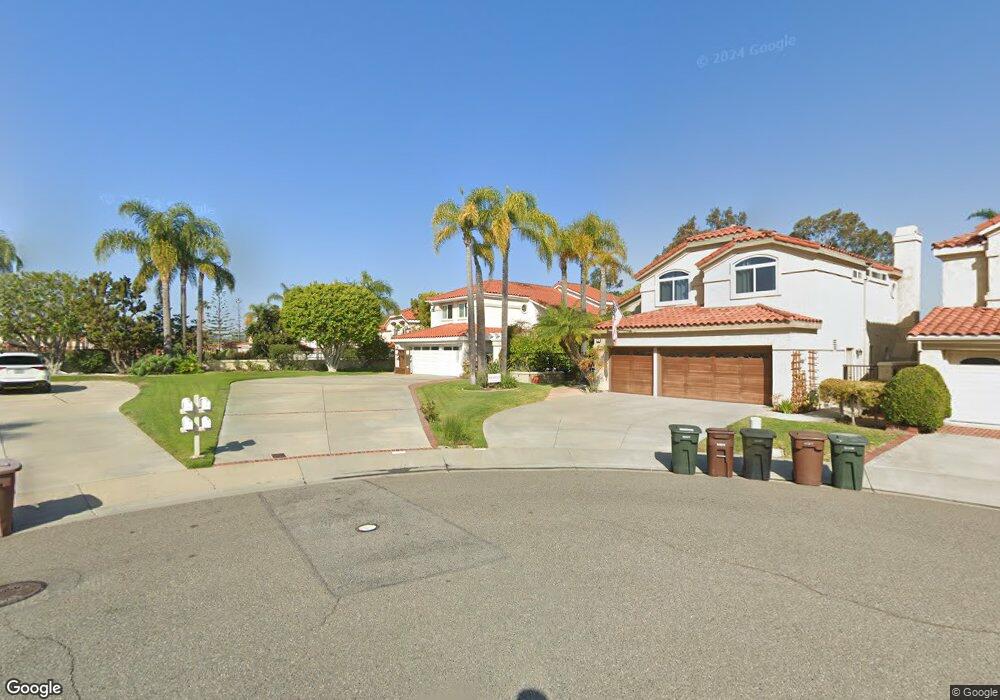
This home is located at 1 Siros, Laguna Niguel, CA 92677 and is currently estimated at $1,849,108, approximately $749 per square foot. 1 Siros is a home located in Orange County with nearby schools including Hidden Hills Elementary, Niguel Hills Middle School, and Dana Hills High School.
Ownership History
Date
Name
Owned For
Owner Type
Purchase Details
Closed on
Jan 13, 2025
Sold by
Vanketel Ellen
Bought by
2025 Ellen Van Ketel Trust and Van Ketel
Current Estimated Value
Purchase Details
Closed on
Jun 11, 1996
Sold by
Keith Codron and Keith Kimberly W
Bought by
Vanvanketel Wynn Van and Ketel Ellen Van
Home Financials for this Owner
Home Financials are based on the most recent Mortgage that was taken out on this home.
Original Mortgage
$60,000
Interest Rate
8.3%
Purchase Details
Closed on
Sep 13, 1995
Sold by
Codron Keith and Codron Kimberly Weiss
Bought by
Codron Keith and Codron Kimberly Weiss
Create a Home Valuation Report for This Property
The Home Valuation Report is an in-depth analysis detailing your home's value as well as a comparison with similar homes in the area
Home Values in the Area
Average Home Value in this Area
Purchase History
| Date | Buyer | Sale Price | Title Company |
|---|---|---|---|
| 2025 Ellen Van Ketel Trust | -- | None Listed On Document | |
| Vanvanketel Wynn Van | $346,000 | Commonwealth Land Title | |
| Codron Keith | -- | -- |
Source: Public Records
Mortgage History
| Date | Status | Borrower | Loan Amount |
|---|---|---|---|
| Previous Owner | Vanvanketel Wynn Van | $60,000 |
Source: Public Records
Tax History Compared to Growth
Tax History
| Year | Tax Paid | Tax Assessment Tax Assessment Total Assessment is a certain percentage of the fair market value that is determined by local assessors to be the total taxable value of land and additions on the property. | Land | Improvement |
|---|---|---|---|---|
| 2025 | $5,538 | $563,522 | $264,493 | $299,029 |
| 2024 | $5,538 | $552,473 | $259,307 | $293,166 |
| 2023 | $5,420 | $541,641 | $254,223 | $287,418 |
| 2022 | $5,315 | $531,021 | $249,238 | $281,783 |
| 2021 | $5,211 | $520,609 | $244,351 | $276,258 |
| 2020 | $5,159 | $515,271 | $241,845 | $273,426 |
| 2019 | $5,056 | $505,168 | $237,103 | $268,065 |
| 2018 | $4,958 | $495,263 | $232,454 | $262,809 |
| 2017 | $4,859 | $485,552 | $227,896 | $257,656 |
| 2016 | $4,765 | $476,032 | $223,428 | $252,604 |
| 2015 | $4,692 | $468,882 | $220,072 | $248,810 |
| 2014 | $4,601 | $459,698 | $215,761 | $243,937 |
Source: Public Records
Map
Nearby Homes