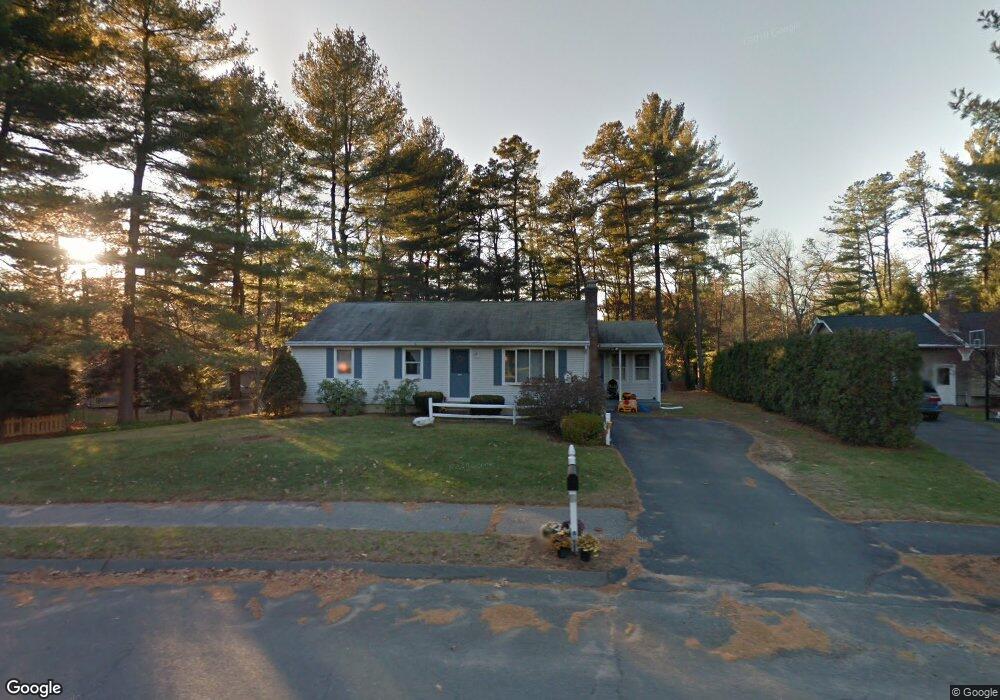
1 Sterling Dr Easthampton, MA 01027
Estimated Value: $390,520 - $439,000
3
Beds
1
Bath
1,144
Sq Ft
$365/Sq Ft
Est. Value
About This Home
This home is located at 1 Sterling Dr, Easthampton, MA 01027 and is currently estimated at $418,130, approximately $365 per square foot. 1 Sterling Dr is a home located in Hampshire County with nearby schools including Easthampton High School, Calvary Baptist Christian School, and Tri-County Schools.
Ownership History
Date
Name
Owned For
Owner Type
Purchase Details
Closed on
Sep 17, 2020
Sold by
Fydenkevez Craig W
Bought by
Fydenkevez Roberta A
Current Estimated Value
Home Financials for this Owner
Home Financials are based on the most recent Mortgage that was taken out on this home.
Original Mortgage
$188,000
Outstanding Balance
$165,697
Interest Rate
2.9%
Mortgage Type
New Conventional
Estimated Equity
$252,433
Purchase Details
Closed on
Aug 1, 2011
Sold by
Sicard Ernest R
Bought by
Fydenkevez Craig W and Fydenkevez Roberta A
Home Financials for this Owner
Home Financials are based on the most recent Mortgage that was taken out on this home.
Original Mortgage
$199,051
Interest Rate
4.52%
Mortgage Type
Purchase Money Mortgage
Create a Home Valuation Report for This Property
The Home Valuation Report is an in-depth analysis detailing your home's value as well as a comparison with similar homes in the area
Home Values in the Area
Average Home Value in this Area
Purchase History
| Date | Buyer | Sale Price | Title Company |
|---|---|---|---|
| Fydenkevez Roberta A | -- | None Available | |
| Fydenkevez Roberta A | -- | None Available | |
| Fydenkevez Craig W | $219,000 | -- | |
| Fydenkevez Craig W | $219,000 | -- |
Source: Public Records
Mortgage History
| Date | Status | Borrower | Loan Amount |
|---|---|---|---|
| Open | Fydenkevez Roberta A | $188,000 | |
| Closed | Fydenkevez Roberta A | $188,000 | |
| Previous Owner | Fydenkevez Craig W | $199,051 |
Source: Public Records
Tax History
| Year | Tax Paid | Tax Assessment Tax Assessment Total Assessment is a certain percentage of the fair market value that is determined by local assessors to be the total taxable value of land and additions on the property. | Land | Improvement |
|---|---|---|---|---|
| 2025 | $4,716 | $345,000 | $120,900 | $224,100 |
| 2024 | $4,789 | $353,200 | $117,500 | $235,700 |
| 2023 | $3,431 | $234,200 | $92,500 | $141,700 |
| 2022 | $3,871 | $234,200 | $92,500 | $141,700 |
| 2021 | $4,231 | $241,200 | $92,500 | $148,700 |
| 2020 | $4,159 | $234,200 | $92,500 | $141,700 |
| 2019 | $3,489 | $225,700 | $92,500 | $133,200 |
| 2018 | $3,344 | $209,000 | $87,200 | $121,800 |
| 2017 | $3,265 | $201,400 | $83,800 | $117,600 |
| 2016 | $3,140 | $201,400 | $83,800 | $117,600 |
| 2015 | $3,051 | $201,400 | $83,800 | $117,600 |
Source: Public Records
Map
Nearby Homes
Your Personal Tour Guide
Ask me questions while you tour the home.