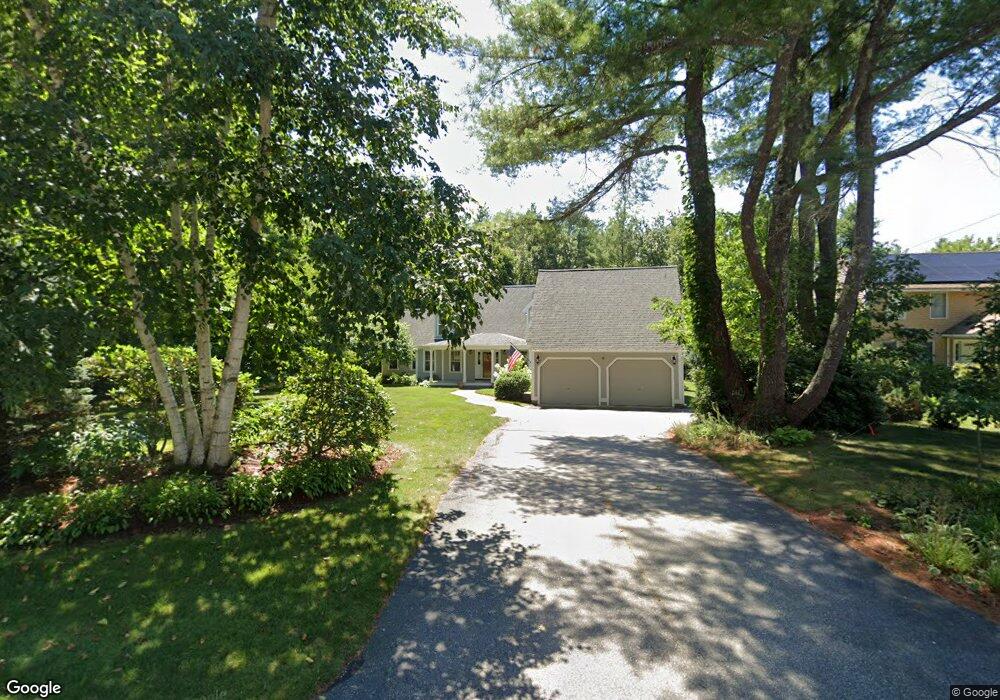
1 Sumac Ln Durham, NH 03824
Estimated Value: $802,000 - $889,000
4
Beds
3
Baths
2,800
Sq Ft
$301/Sq Ft
Est. Value
About This Home
This home is located at 1 Sumac Ln, Durham, NH 03824 and is currently estimated at $843,670, approximately $301 per square foot. 1 Sumac Ln is a home located in Strafford County with nearby schools including Mast Way School, Oyster River Middle School, and Oyster River High School.
Ownership History
Date
Name
Owned For
Owner Type
Purchase Details
Closed on
Apr 23, 2012
Sold by
Eva M Clark T M and Eva Clark
Bought by
Eva M Clark T M and Eva Clark
Current Estimated Value
Home Financials for this Owner
Home Financials are based on the most recent Mortgage that was taken out on this home.
Original Mortgage
$297,500
Outstanding Balance
$203,818
Interest Rate
3.89%
Mortgage Type
New Conventional
Estimated Equity
$639,852
Purchase Details
Closed on
Jun 20, 2000
Sold by
Stoebe Detlef
Bought by
Healy Mary Jane
Home Financials for this Owner
Home Financials are based on the most recent Mortgage that was taken out on this home.
Original Mortgage
$244,000
Interest Rate
8.24%
Mortgage Type
Purchase Money Mortgage
Create a Home Valuation Report for This Property
The Home Valuation Report is an in-depth analysis detailing your home's value as well as a comparison with similar homes in the area
Home Values in the Area
Average Home Value in this Area
Purchase History
| Date | Buyer | Sale Price | Title Company |
|---|---|---|---|
| Eva M Clark T M | -- | -- | |
| Eva M Clark T | -- | -- | |
| Healy Mary Jane | $305,000 | -- | |
| Healy Mary Jane | $305,000 | -- | |
| Eva M Clark T M | -- | -- |
Source: Public Records
Mortgage History
| Date | Status | Borrower | Loan Amount |
|---|---|---|---|
| Open | Healy Mary Jane | $297,500 | |
| Closed | Healy Mary Jane | $297,500 | |
| Previous Owner | Healy Mary Jane | $244,000 |
Source: Public Records
Tax History Compared to Growth
Tax History
| Year | Tax Paid | Tax Assessment Tax Assessment Total Assessment is a certain percentage of the fair market value that is determined by local assessors to be the total taxable value of land and additions on the property. | Land | Improvement |
|---|---|---|---|---|
| 2024 | $13,928 | $685,100 | $240,100 | $445,000 |
| 2023 | $14,031 | $685,100 | $240,100 | $445,000 |
| 2022 | $12,377 | $426,200 | $130,100 | $296,100 |
| 2021 | $11,901 | $426,400 | $130,300 | $296,100 |
| 2020 | $11,824 | $426,400 | $130,300 | $296,100 |
| 2019 | $11,696 | $426,400 | $130,300 | $296,100 |
| 2018 | $5,135 | $426,400 | $130,300 | $296,100 |
| 2017 | $12,008 | $391,900 | $100,300 | $291,600 |
| 2016 | $11,152 | $375,100 | $100,300 | $274,800 |
| 2015 | $11,197 | $375,100 | $100,300 | $274,800 |
| 2014 | $11,448 | $375,100 | $100,300 | $274,800 |
| 2013 | $11,407 | $375,100 | $100,300 | $274,800 |
Source: Public Records
Map
Nearby Homes
- 3 Ambler Way
- 25 Emerson Rd
- 7 Beards Landing
- 0 Emerson Rd Unit 10
- 32 Woodman Rd
- 10 Young Dr
- 14 Young Dr
- 11 Young Dr
- 9 Young Dr
- 3-7 Jenkins Ct
- 31 Faculty Rd
- 0 Beech Hill Rd Unit 201-02-0-0-0,204-10-
- 34 Victory Way
- 1 Riverview Ct
- 54 Cielo Dr
- 275-279 Mast Rd
- 17 Foss Farm Rd
- 88 Durham Point Rd
- 4 Tanglewood Dr
- 30 Ffrost Dr