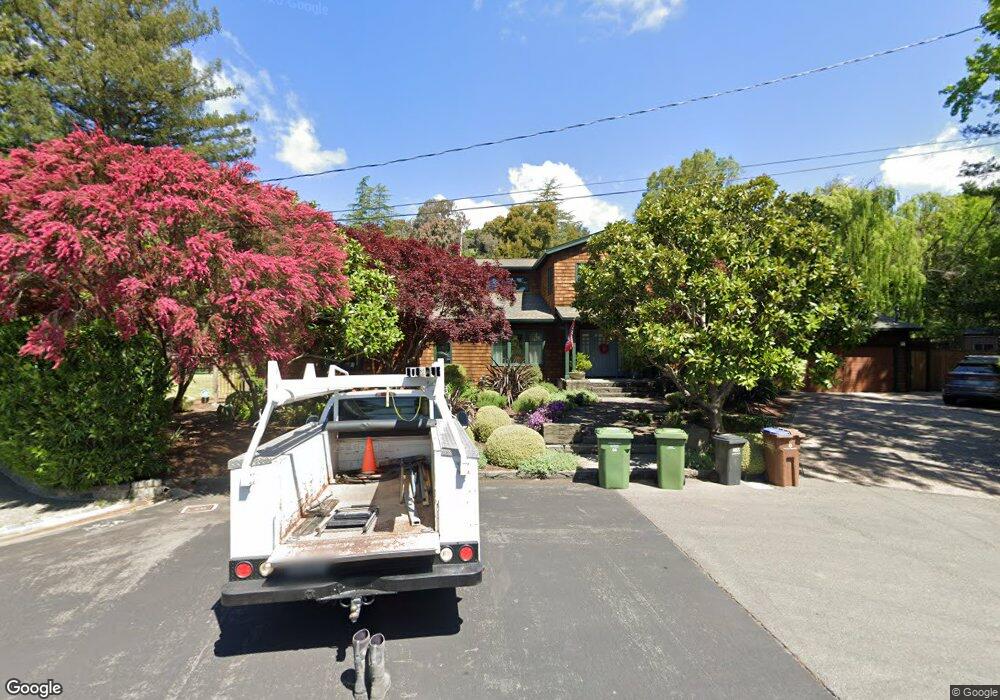
1 Tappan Ct San Anselmo, CA 94960
Sleepy Hollow NeighborhoodEstimated Value: $3,561,000 - $4,648,000
4
Beds
5
Baths
4,195
Sq Ft
$953/Sq Ft
Est. Value
About This Home
This home is located at 1 Tappan Ct, San Anselmo, CA 94960 and is currently estimated at $3,997,650, approximately $952 per square foot. 1 Tappan Ct is a home located in Marin County with nearby schools including Hidden Valley Elementary School, White Hill Middle School, and Archie Williams High School.
Ownership History
Date
Name
Owned For
Owner Type
Purchase Details
Closed on
Aug 25, 2005
Sold by
Rosen Scott R and Rosen Krista A
Bought by
Rosen Scott R and Rosen Krista A
Current Estimated Value
Purchase Details
Closed on
May 29, 2004
Sold by
Rabe Brian D and Rabe Denise M
Bought by
Rosen Scott R and Rosen Krista A
Home Financials for this Owner
Home Financials are based on the most recent Mortgage that was taken out on this home.
Original Mortgage
$1,462,500
Interest Rate
6.27%
Mortgage Type
Purchase Money Mortgage
Purchase Details
Closed on
Jul 17, 1997
Sold by
Brigham John P and Brigham Sandi A
Bought by
Rabe Brian D and Rabe Denise M
Home Financials for this Owner
Home Financials are based on the most recent Mortgage that was taken out on this home.
Original Mortgage
$365,000
Interest Rate
7.62%
Create a Home Valuation Report for This Property
The Home Valuation Report is an in-depth analysis detailing your home's value as well as a comparison with similar homes in the area
Home Values in the Area
Average Home Value in this Area
Purchase History
| Date | Buyer | Sale Price | Title Company |
|---|---|---|---|
| Rosen Scott R | -- | -- | |
| Rosen Scott R | $2,250,000 | -- | |
| Rabe Brian D | $865,000 | Old Republic Title Company |
Source: Public Records
Mortgage History
| Date | Status | Borrower | Loan Amount |
|---|---|---|---|
| Previous Owner | Rosen Scott R | $1,462,500 | |
| Previous Owner | Rabe Brian D | $365,000 | |
| Closed | Rosen Scott R | $337,500 |
Source: Public Records
Tax History
| Year | Tax Paid | Tax Assessment Tax Assessment Total Assessment is a certain percentage of the fair market value that is determined by local assessors to be the total taxable value of land and additions on the property. | Land | Improvement |
|---|---|---|---|---|
| 2025 | $39,178 | $3,225,763 | $1,951,292 | $1,274,471 |
| 2024 | $37,781 | $3,162,534 | $1,913,044 | $1,249,490 |
| 2023 | $37,503 | $3,100,530 | $1,875,538 | $1,224,992 |
| 2022 | $37,196 | $3,039,754 | $1,838,774 | $1,200,980 |
| 2021 | $36,414 | $2,980,159 | $1,802,724 | $1,177,435 |
| 2020 | $36,093 | $2,949,608 | $1,784,244 | $1,165,364 |
| 2019 | $34,968 | $2,891,795 | $1,749,272 | $1,142,523 |
| 2018 | $34,316 | $2,835,115 | $1,714,986 | $1,120,129 |
| 2017 | $33,728 | $2,779,547 | $1,681,372 | $1,098,175 |
| 2016 | $31,529 | $2,670,302 | $1,517,218 | $1,153,084 |
| 2015 | $30,284 | $2,519,154 | $1,431,338 | $1,087,816 |
| 2014 | $26,751 | $2,249,246 | $1,277,981 | $971,265 |
Source: Public Records
Map
Nearby Homes
- 16 Dutch Valley Ln
- 33 Fawn Dr
- 841 Montecillo Rd
- 99 Fawn Dr
- 338 Olema Rd
- 829 Del Ganado Rd
- 5 Maoli Dr
- 876 Las Ovejas Ave
- 6 Hunter Creek
- 327 Butterfield Rd
- 211 Danielle Dr
- 2 Baytree Ln
- 750 Montecillo Rd
- 405 Sylvia Way
- 952 Lea Dr Unit 30
- 19 Surrey Ln
- 5 Creekside Dr
- 250 Butterfield Rd
- 118 Marinda Dr
- 0 Holstein Rd
- 35 Garden Rock Rd
- 2 Tappan Ct
- 3 Tappan Ct
- 25 Garden Rock Rd
- 4 Greensburgh Ln
- 45 Garden Rock Rd
- 4 Tappan Ct
- 5 Tappan Ct
- 12 Greensburgh Ln
- 15 Garden Rock Rd
- 21 Crane Dr
- 57 Garden Rock Rd
- 25 Crane Dr
- 6 Tappan Ct
- 20 Garden Rock Rd
- 7 Tappan Ct
- 3 Greensburgh Ln
- 16 Greensburgh Ln
- 40 Garden Rock Rd
- 3 Whiteplains Ct
Your Personal Tour Guide
Ask me questions while you tour the home.