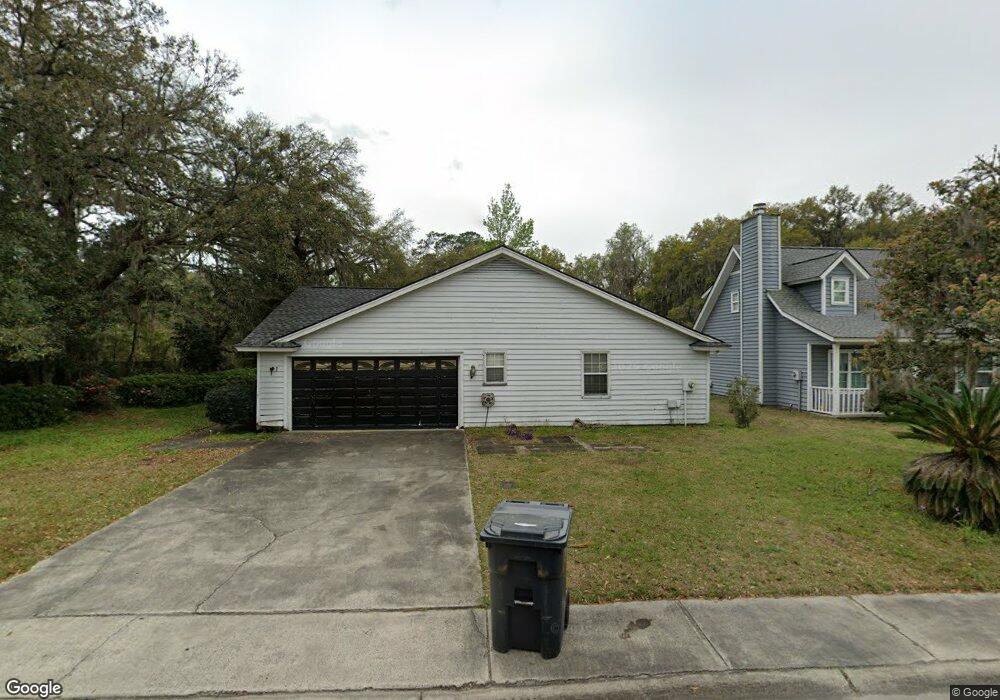
1 Tara Manor Dr Savannah, GA 31406
Sandfly NeighborhoodEstimated Value: $321,000 - $438,000
3
Beds
2
Baths
1,370
Sq Ft
$259/Sq Ft
Est. Value
About This Home
This home is located at 1 Tara Manor Dr, Savannah, GA 31406 and is currently estimated at $354,595, approximately $258 per square foot. 1 Tara Manor Dr is a home located in Chatham County with nearby schools including Isle Of Hope School, Johnson High School, and Oglethorpe Charter School.
Ownership History
Date
Name
Owned For
Owner Type
Purchase Details
Closed on
Oct 18, 2010
Sold by
Cummings Ebony
Bought by
Cummings Ebony and Cummings Kashif
Current Estimated Value
Home Financials for this Owner
Home Financials are based on the most recent Mortgage that was taken out on this home.
Original Mortgage
$66,462
Outstanding Balance
$43,849
Interest Rate
4.5%
Mortgage Type
FHA
Estimated Equity
$310,746
Purchase Details
Closed on
Feb 2, 2010
Sold by
Flagstar Bank Fsb
Bought by
Sec Of Housing & Urban
Purchase Details
Closed on
Jan 31, 2008
Sold by
Not Provided
Bought by
Cummings Ebony and Cummings Kashif
Home Financials for this Owner
Home Financials are based on the most recent Mortgage that was taken out on this home.
Original Mortgage
$157,528
Interest Rate
6.06%
Mortgage Type
FHA
Create a Home Valuation Report for This Property
The Home Valuation Report is an in-depth analysis detailing your home's value as well as a comparison with similar homes in the area
Home Values in the Area
Average Home Value in this Area
Purchase History
| Date | Buyer | Sale Price | Title Company |
|---|---|---|---|
| Cummings Ebony | -- | -- | |
| Cammings Ebony | $79,000 | -- | |
| Sec Of Housing & Urban | $170,654 | -- | |
| Flagstar Bank Fsb | $170,654 | -- | |
| Cummings Ebony | -- | -- |
Source: Public Records
Mortgage History
| Date | Status | Borrower | Loan Amount |
|---|---|---|---|
| Open | Cammings Ebony | $66,462 | |
| Previous Owner | Cummings Ebony | $157,528 |
Source: Public Records
Tax History
| Year | Tax Paid | Tax Assessment Tax Assessment Total Assessment is a certain percentage of the fair market value that is determined by local assessors to be the total taxable value of land and additions on the property. | Land | Improvement |
|---|---|---|---|---|
| 2025 | $4,740 | $121,720 | $26,400 | $95,320 |
| 2024 | $29 | $108,440 | $26,400 | $82,040 |
| 2023 | $2,871 | $81,880 | $17,600 | $64,280 |
| 2022 | $2,428 | $75,680 | $17,600 | $58,080 |
| 2021 | $2,579 | $68,160 | $17,600 | $50,560 |
| 2020 | $2,356 | $64,560 | $17,600 | $46,960 |
| 2019 | $2,466 | $64,560 | $17,600 | $46,960 |
| 2018 | $2,436 | $63,600 | $17,600 | $46,000 |
| 2017 | $1,746 | $45,040 | $8,800 | $36,240 |
| 2016 | $1,570 | $45,080 | $8,800 | $36,280 |
| 2015 | $1,479 | $42,280 | $9,000 | $33,280 |
| 2014 | $2,171 | $42,920 | $0 | $0 |
Source: Public Records
Map
Nearby Homes
- 8621 Ferguson Ave
- 7346 Leghorn St
- 117 Fox Chase Rd
- 131 Fox Chase Rd
- 7322 Albert St
- 109 Canter Ct
- 0 Albert St Unit SA337026
- 106 Hunt Club Ct
- 108 Canter Ct
- 130 Canter Ct
- 7308 Garfield St
- 7 Bakers Crossing
- 9 Colonel Estill Ave
- 7245 Garfield St
- 7238 Grant St
- 22 Bakers Crossing
- 106 Holcomb St
- 8511 Kent Dr
- 7221 Garfield St
- 4 Cross Bow Ct
Your Personal Tour Guide
Ask me questions while you tour the home.