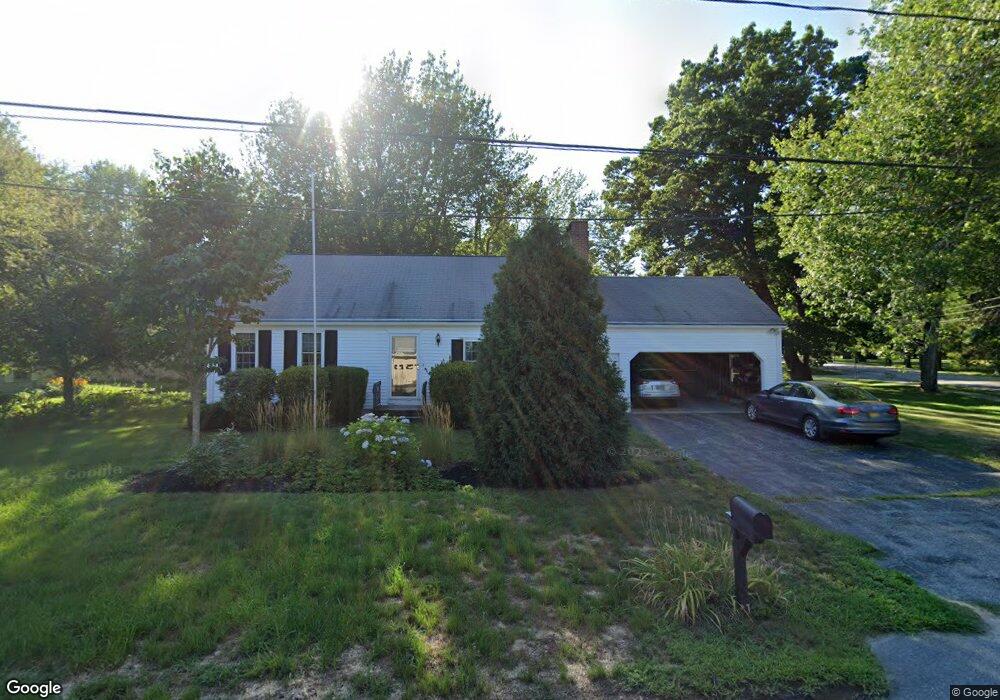
1 Tiffany Ln Saco, ME 04072
East Saco NeighborhoodEstimated Value: $450,312 - $531,000
2
Beds
1
Bath
988
Sq Ft
$480/Sq Ft
Est. Value
About This Home
This home is located at 1 Tiffany Ln, Saco, ME 04072 and is currently estimated at $474,328, approximately $480 per square foot. 1 Tiffany Ln is a home located in York County with nearby schools including C K Burns School, Saco Middle School, and Saint James School.
Ownership History
Date
Name
Owned For
Owner Type
Purchase Details
Closed on
Apr 23, 2014
Sold by
Bayview Loan Servicing
Bought by
Department Of Housing & Urban Dev
Current Estimated Value
Purchase Details
Closed on
Jul 27, 2005
Sold by
Swanson Olga E
Bought by
Rogers Beth M and Rogers Martin S
Home Financials for this Owner
Home Financials are based on the most recent Mortgage that was taken out on this home.
Original Mortgage
$245,900
Outstanding Balance
$127,630
Interest Rate
5.67%
Mortgage Type
FHA
Estimated Equity
$346,698
Create a Home Valuation Report for This Property
The Home Valuation Report is an in-depth analysis detailing your home's value as well as a comparison with similar homes in the area
Home Values in the Area
Average Home Value in this Area
Purchase History
| Date | Buyer | Sale Price | Title Company |
|---|---|---|---|
| Department Of Housing & Urban Dev | -- | -- | |
| Rogers Beth M | -- | -- |
Source: Public Records
Mortgage History
| Date | Status | Borrower | Loan Amount |
|---|---|---|---|
| Open | Rogers Beth M | $245,900 |
Source: Public Records
Tax History Compared to Growth
Tax History
| Year | Tax Paid | Tax Assessment Tax Assessment Total Assessment is a certain percentage of the fair market value that is determined by local assessors to be the total taxable value of land and additions on the property. | Land | Improvement |
|---|---|---|---|---|
| 2024 | $4,790 | $340,900 | $149,100 | $191,800 |
| 2023 | $5,028 | $340,900 | $149,100 | $191,800 |
| 2022 | $4,561 | $248,800 | $113,500 | $135,300 |
| 2021 | $4,391 | $232,600 | $102,900 | $129,700 |
| 2020 | $4,143 | $210,600 | $92,200 | $118,400 |
| 2019 | $4,081 | $210,600 | $92,200 | $118,400 |
| 2018 | $4,012 | $207,000 | $88,600 | $118,400 |
| 2017 | $3,692 | $190,500 | $80,600 | $109,900 |
| 2016 | $3,727 | $191,900 | $80,600 | $111,300 |
| 2015 | $3,661 | $190,500 | $80,600 | $109,900 |
| 2014 | $3,547 | $190,500 | $80,600 | $109,900 |
| 2013 | $3,539 | $190,500 | $80,600 | $109,900 |
Source: Public Records
Map
Nearby Homes
- TBD 530 Ferry Rd
- 378 Pool St
- 353 Pool St
- 343 Pool St
- 30 Vines Rd
- 57 Plymouth Dr
- 19 Ocean Greens Dr
- 26 Ocean Greens Dr
- 15 Thunder Rd
- 2 Breakwater Way Unit 2
- 1 Pine Ridge Rd
- 6 Tide Water Dr
- 38 Pine Ridge Rd
- 4 Mainsail Ln Unit 4
- 625,650 Pool St
- 29 Old Orchard Rd Unit 10
- part of 31 Sokokis Rd
- 2 Burleigh Ln
- 8 Heritage Way Unit 15
- 8 Heritage Way Unit 21