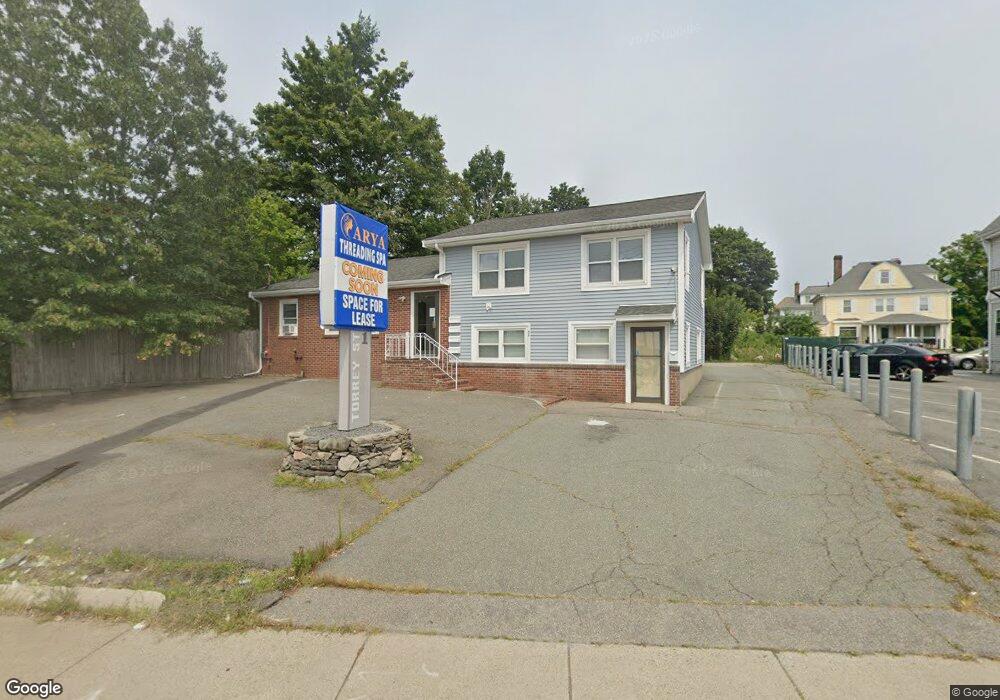
1 Torrey St Unit 2 Brockton, MA 02301
Estimated Value: $662,842
3
Beds
1
Bath
3,048
Sq Ft
$217/Sq Ft
Est. Value
About This Home
This home is located at 1 Torrey St Unit 2, Brockton, MA 02301 and is currently estimated at $662,842, approximately $217 per square foot. 1 Torrey St Unit 2 is a home located in Plymouth County with nearby schools including Manthala George Jr. School, Louis F Angelo Elementary School, and Hancock Elementary School.
Ownership History
Date
Name
Owned For
Owner Type
Purchase Details
Closed on
Sep 7, 2012
Sold by
Hogan Ent Inc
Bought by
Hmd Rt and Fitzgerald
Current Estimated Value
Purchase Details
Closed on
Dec 29, 1997
Sold by
Landry Joseph P
Bought by
Hogan Ent Inc
Home Financials for this Owner
Home Financials are based on the most recent Mortgage that was taken out on this home.
Original Mortgage
$90,000
Interest Rate
7.15%
Mortgage Type
Commercial
Create a Home Valuation Report for This Property
The Home Valuation Report is an in-depth analysis detailing your home's value as well as a comparison with similar homes in the area
Home Values in the Area
Average Home Value in this Area
Purchase History
| Date | Buyer | Sale Price | Title Company |
|---|---|---|---|
| Hmd Rt | -- | -- | |
| Hmd Rt | -- | -- | |
| Hogan Ent Inc | $120,000 | -- | |
| Hogan Ent Inc | $120,000 | -- |
Source: Public Records
Mortgage History
| Date | Status | Borrower | Loan Amount |
|---|---|---|---|
| Previous Owner | Hogan Ent Inc | $90,000 | |
| Previous Owner | Hogan Ent Inc | $72,000 |
Source: Public Records
Tax History Compared to Growth
Tax History
| Year | Tax Paid | Tax Assessment Tax Assessment Total Assessment is a certain percentage of the fair market value that is determined by local assessors to be the total taxable value of land and additions on the property. | Land | Improvement |
|---|---|---|---|---|
| 2025 | -- | $451,700 | $214,900 | $236,800 |
| 2024 | -- | $426,500 | $214,900 | $211,600 |
| 2023 | $0 | $377,400 | $180,100 | $197,300 |
| 2022 | $0 | $348,800 | $180,100 | $168,700 |
| 2021 | $0 | $329,600 | $171,600 | $158,000 |
| 2020 | $6,226 | $317,800 | $163,400 | $154,400 |
| 2019 | $0 | $267,900 | $163,400 | $104,500 |
| 2018 | $5,749 | $261,100 | $163,400 | $97,700 |
| 2017 | -- | $236,100 | $163,400 | $72,700 |
| 2016 | -- | $290,500 | $163,410 | $127,090 |
| 2015 | -- | $290,500 | $163,410 | $127,090 |
| 2014 | -- | $290,500 | $163,410 | $127,090 |
Source: Public Records
Map
Nearby Homes
- 128 Winnifred Rd
- 493 Belmont St
- 493 Belmont St
- 493 Belmont St Unit 3
- 120 Winnifred Rd
- 0 Lot 7 Torrey St Unit 50493345
- 114 Winnifred Rd
- 121 Belcher Ave
- 106 Winnifred Rd
- 129 Winnifred Rd
- 125 Winnifred Rd
- 113 Belcher Ave
- 121 Winnifred Rd
- 137 Winnifred Rd
- 15 Torrey St Unit 1
- 104 Winnifred Rd
- 115 Winnifred Rd
- 120 Belcher Ave
- 105 Belcher Ave
- 111 Winnifred Rd