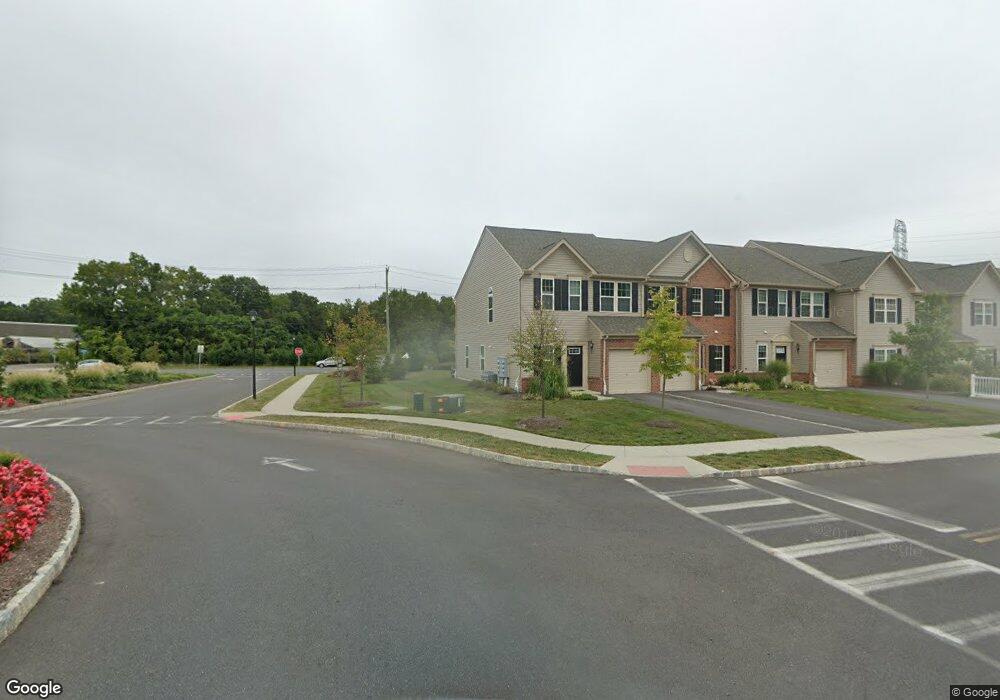
1 Ventana Ct Trenton, NJ 08619
Estimated Value: $465,000 - $497,000
--
Bed
--
Bath
1,730
Sq Ft
$280/Sq Ft
Est. Value
About This Home
This home is located at 1 Ventana Ct, Trenton, NJ 08619 and is currently estimated at $484,026, approximately $279 per square foot. 1 Ventana Ct is a home with nearby schools including Kuser Elementary School, Emily C. Reynolds Middle School, and Steinert - Hamilton High East.
Ownership History
Date
Name
Owned For
Owner Type
Purchase Details
Closed on
Nov 30, 2016
Sold by
Nvr Inc
Bought by
Williams Nurocha
Current Estimated Value
Home Financials for this Owner
Home Financials are based on the most recent Mortgage that was taken out on this home.
Original Mortgage
$296,580
Outstanding Balance
$239,631
Interest Rate
3.54%
Mortgage Type
New Conventional
Estimated Equity
$244,395
Purchase Details
Closed on
May 9, 2016
Sold by
Jdme Kuser Road Llc
Bought by
Nvr Inc and Ryan Homes
Create a Home Valuation Report for This Property
The Home Valuation Report is an in-depth analysis detailing your home's value as well as a comparison with similar homes in the area
Home Values in the Area
Average Home Value in this Area
Purchase History
| Date | Buyer | Sale Price | Title Company |
|---|---|---|---|
| Williams Nurocha | $312,912 | Legacy Title Agency Llc | |
| Nvr Inc | $109,525 | Title America Agency |
Source: Public Records
Mortgage History
| Date | Status | Borrower | Loan Amount |
|---|---|---|---|
| Open | Williams Nurocha | $296,580 |
Source: Public Records
Tax History Compared to Growth
Tax History
| Year | Tax Paid | Tax Assessment Tax Assessment Total Assessment is a certain percentage of the fair market value that is determined by local assessors to be the total taxable value of land and additions on the property. | Land | Improvement |
|---|---|---|---|---|
| 2025 | $9,691 | $275,000 | $60,000 | $215,000 |
| 2024 | $9,083 | $275,000 | $60,000 | $215,000 |
| 2023 | $9,083 | $275,000 | $60,000 | $215,000 |
| 2022 | $8,940 | $275,000 | $60,000 | $215,000 |
| 2021 | $10,266 | $275,000 | $60,000 | $215,000 |
| 2020 | $9,276 | $275,000 | $60,000 | $215,000 |
| 2019 | $9,034 | $275,000 | $60,000 | $215,000 |
| 2018 | $8,932 | $275,000 | $60,000 | $215,000 |
| 2017 | $8,368 | $271,500 | $60,000 | $211,500 |
| 2016 | $676 | $25,000 | $25,000 | $0 |
| 2015 | $826 | $17,000 | $17,000 | $0 |
| 2014 | -- | $0 | $0 | $0 |
Source: Public Records
Map
Nearby Homes