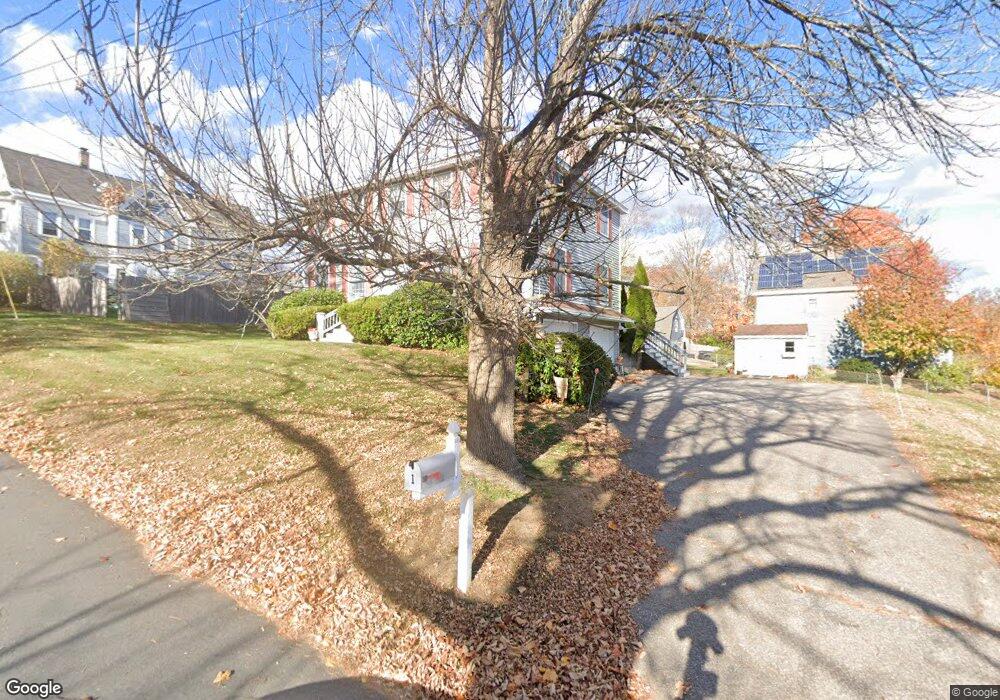
1 Vine St Amesbury, MA 01913
Estimated Value: $774,584 - $936,000
4
Beds
3
Baths
2,146
Sq Ft
$396/Sq Ft
Est. Value
About This Home
This home is located at 1 Vine St, Amesbury, MA 01913 and is currently estimated at $850,646, approximately $396 per square foot. 1 Vine St is a home located in Essex County with nearby schools including Amesbury High School and Amesbury Seventh-Day Adventist School.
Ownership History
Date
Name
Owned For
Owner Type
Purchase Details
Closed on
Jan 19, 2017
Sold by
Adelman-Desisto Cynthia
Bought by
Desist Cynthia Adelman
Current Estimated Value
Purchase Details
Closed on
Mar 3, 2011
Sold by
Joyee Thomas A and Joyee Michelle E
Bought by
Desisto Cynthia A
Home Financials for this Owner
Home Financials are based on the most recent Mortgage that was taken out on this home.
Original Mortgage
$150,000
Interest Rate
4.76%
Mortgage Type
Purchase Money Mortgage
Create a Home Valuation Report for This Property
The Home Valuation Report is an in-depth analysis detailing your home's value as well as a comparison with similar homes in the area
Home Values in the Area
Average Home Value in this Area
Purchase History
| Date | Buyer | Sale Price | Title Company |
|---|---|---|---|
| Desist Cynthia Adelman | -- | -- | |
| Desisto Cynthia A | $345,000 | -- |
Source: Public Records
Mortgage History
| Date | Status | Borrower | Loan Amount |
|---|---|---|---|
| Previous Owner | Desisto Cynthia A | $150,000 |
Source: Public Records
Tax History
| Year | Tax Paid | Tax Assessment Tax Assessment Total Assessment is a certain percentage of the fair market value that is determined by local assessors to be the total taxable value of land and additions on the property. | Land | Improvement |
|---|---|---|---|---|
| 2025 | $10,005 | $653,900 | $224,400 | $429,500 |
| 2024 | $9,539 | $609,900 | $211,700 | $398,200 |
| 2023 | $8,941 | $547,200 | $184,100 | $363,100 |
| 2022 | $8,567 | $484,300 | $160,100 | $324,200 |
| 2021 | $8,041 | $440,600 | $123,700 | $316,900 |
| 2020 | $7,173 | $417,500 | $119,000 | $298,500 |
| 2019 | $7,260 | $395,200 | $119,000 | $276,200 |
| 2018 | $7,144 | $376,200 | $113,300 | $262,900 |
| 2017 | $7,320 | $366,900 | $113,300 | $253,600 |
| 2016 | $7,112 | $350,700 | $113,300 | $237,400 |
| 2015 | $6,965 | $339,100 | $113,300 | $225,800 |
| 2014 | $6,771 | $322,900 | $113,300 | $209,600 |
Source: Public Records
Map
Nearby Homes
- 1 Brown Ave Unit 1-25
- 149 Market St
- 25 Whittier Meadows Dr
- 105 Market St Unit B
- 101 Market St Unit B
- 3 Tremont Ave Unit A
- 37 Powow St
- 48 Orchard St
- 25 Cedar St Unit 4
- 97 Elm St
- 4 Clark St
- 9 Elmwood St
- 14 Mason Ct Unit 14
- 20 Mason Ct
- 21 River St
- 1 Hillside Ave Unit 3
- 4 Greenwood St
- 82 Monroe St
- 51 Locust St
- 253 Main St
Your Personal Tour Guide
Ask me questions while you tour the home.