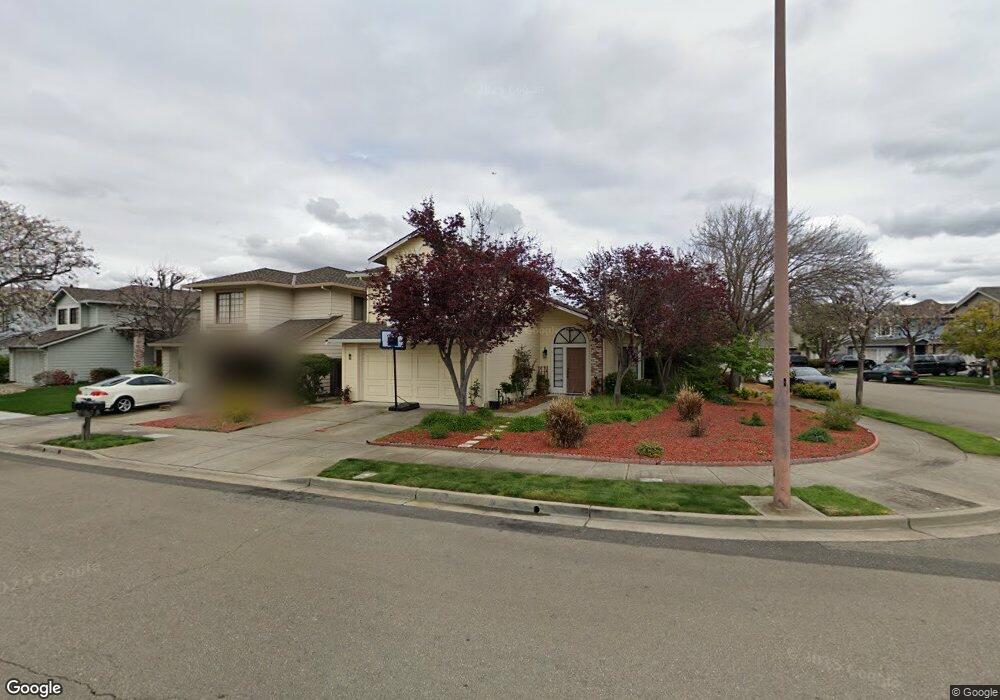
1 Vista Rd Alameda, CA 94502
Harbor Bay/Bay Farm NeighborhoodEstimated Value: $1,173,000 - $1,653,000
3
Beds
3
Baths
1,652
Sq Ft
$847/Sq Ft
Est. Value
About This Home
This home is located at 1 Vista Rd, Alameda, CA 94502 and is currently estimated at $1,398,756, approximately $846 per square foot. 1 Vista Rd is a home located in Alameda County with nearby schools including Bay Farm School, Lincoln Middle School, and Alameda High School.
Ownership History
Date
Name
Owned For
Owner Type
Purchase Details
Closed on
Sep 24, 2008
Sold by
Rashid Suraya
Bought by
Adina Seema Chizala
Current Estimated Value
Purchase Details
Closed on
Jun 7, 2008
Sold by
Rahmani Habibulla
Bought by
Rashid Seema Ghizala and Rashid Suraya
Purchase Details
Closed on
Dec 3, 1998
Sold by
K Woon Ben F H and K Lena
Bought by
Rahmani Habibullah
Home Financials for this Owner
Home Financials are based on the most recent Mortgage that was taken out on this home.
Original Mortgage
$225,000
Interest Rate
6.69%
Mortgage Type
Stand Alone First
Purchase Details
Closed on
Dec 2, 1998
Sold by
Ismatt Deiana
Bought by
Rahmani Habibullah
Home Financials for this Owner
Home Financials are based on the most recent Mortgage that was taken out on this home.
Original Mortgage
$225,000
Interest Rate
6.69%
Mortgage Type
Stand Alone First
Purchase Details
Closed on
Mar 30, 1994
Sold by
Woon Bwanne M and Woon Wendy K
Bought by
Woon Ben F and Woon Lena H
Create a Home Valuation Report for This Property
The Home Valuation Report is an in-depth analysis detailing your home's value as well as a comparison with similar homes in the area
Home Values in the Area
Average Home Value in this Area
Purchase History
| Date | Buyer | Sale Price | Title Company |
|---|---|---|---|
| Adina Seema Chizala | -- | None Available | |
| Rashid Seema Ghizala | -- | None Available | |
| Rahmani Habibulla | -- | None Available | |
| Rahmani Habibullah | $362,000 | Placer Title Company | |
| Rahmani Habibullah | -- | Placer Title Company | |
| Woon Ben F | -- | -- |
Source: Public Records
Mortgage History
| Date | Status | Borrower | Loan Amount |
|---|---|---|---|
| Previous Owner | Rahmani Habibullah | $225,000 |
Source: Public Records
Tax History
| Year | Tax Paid | Tax Assessment Tax Assessment Total Assessment is a certain percentage of the fair market value that is determined by local assessors to be the total taxable value of land and additions on the property. | Land | Improvement |
|---|---|---|---|---|
| 2025 | $12,029 | $832,351 | $249,705 | $582,646 |
| 2024 | $12,029 | $816,034 | $244,810 | $571,224 |
| 2023 | $11,570 | $800,037 | $240,011 | $560,026 |
| 2022 | $11,312 | $784,354 | $235,306 | $549,048 |
| 2021 | $11,034 | $768,978 | $230,693 | $538,285 |
| 2020 | $10,901 | $761,097 | $228,329 | $532,768 |
| 2019 | $10,348 | $746,178 | $223,853 | $522,325 |
| 2018 | $9,985 | $731,551 | $219,465 | $512,086 |
| 2017 | $9,621 | $717,208 | $215,162 | $502,046 |
| 2016 | $9,639 | $703,148 | $210,944 | $492,204 |
| 2015 | $9,610 | $692,591 | $207,777 | $484,814 |
| 2014 | $9,167 | $679,030 | $203,709 | $475,321 |
Source: Public Records
Map
Nearby Homes
- 423 Mcdonnel Rd
- 36 Bannister Way
- 35 Leonard Ct
- 267 Ennismore Ct
- 154 Basinside Way
- 1037 Via Bonita
- 2959 Sea View Pkwy
- 137 Parfait Ln
- 179 Oyster Pond Rd
- 28 Sunny Cove Cir
- 3037 Linda Vista
- 3032 Linda Vista
- 30 Sea Bridge
- 1119 Camino Del Valle
- 2101 Shoreline Dr Unit 153
- 2101 Shoreline Dr Unit 475
- 1160 Marianas Ln
- 405 Centre Ct
- 1152 Admiralty Ln
- 608 Centre Ct
Your Personal Tour Guide
Ask me questions while you tour the home.