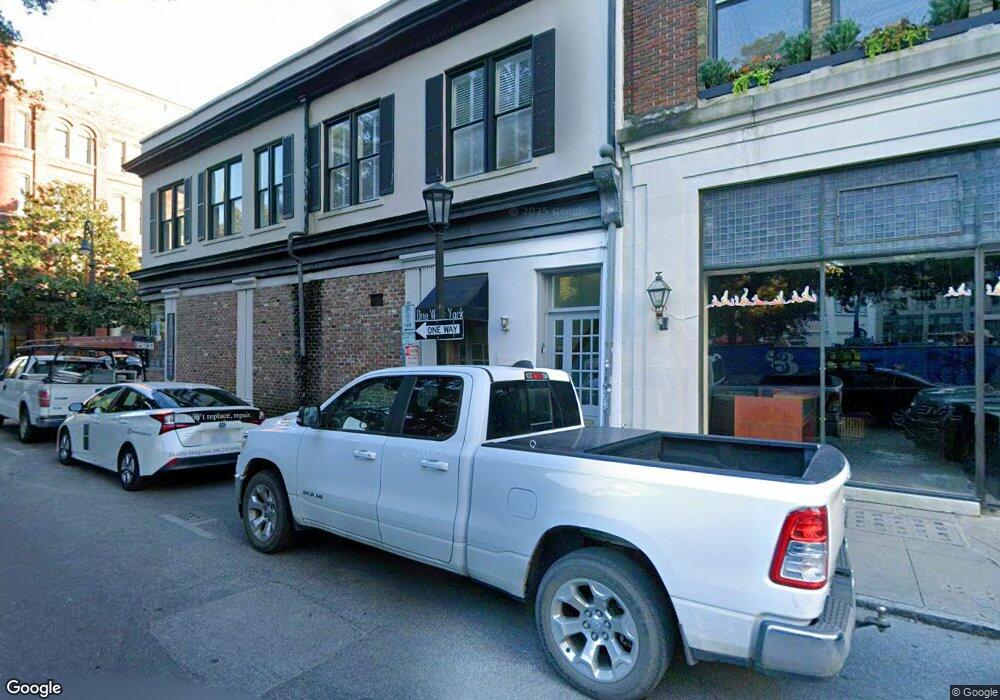
1 W York St Unit A & B Savannah, GA 31401
Historic Savannah NeighborhoodEstimated Value: $416,000 - $840,000
2
Beds
2
Baths
1,358
Sq Ft
$457/Sq Ft
Est. Value
About This Home
This home is located at 1 W York St Unit A & B, Savannah, GA 31401 and is currently estimated at $620,610, approximately $457 per square foot. 1 W York St Unit A & B is a home located in Chatham County with nearby schools including Otis J. Brock, III Elementary School, Mercer Middle School, and Groves High School.
Ownership History
Date
Name
Owned For
Owner Type
Purchase Details
Closed on
Feb 24, 2017
Sold by
Russom Kevin M
Bought by
Lance William H and Lance Robin B
Current Estimated Value
Home Financials for this Owner
Home Financials are based on the most recent Mortgage that was taken out on this home.
Original Mortgage
$382,500
Outstanding Balance
$316,836
Interest Rate
4.13%
Mortgage Type
Commercial
Estimated Equity
$303,774
Purchase Details
Closed on
Dec 9, 2014
Sold by
Willard Daniel Hansen
Bought by
Russom Kevin M and Russom Gail A
Purchase Details
Closed on
Jul 30, 2012
Sold by
Federal National Mortgage Association
Bought by
Willard Daniel Hansen and Willard Cassady Lance
Home Financials for this Owner
Home Financials are based on the most recent Mortgage that was taken out on this home.
Original Mortgage
$256,950
Interest Rate
3.68%
Mortgage Type
Commercial
Purchase Details
Closed on
May 1, 2012
Sold by
Suntrust Mtg Inc
Bought by
Federal National Mtg Associati
Create a Home Valuation Report for This Property
The Home Valuation Report is an in-depth analysis detailing your home's value as well as a comparison with similar homes in the area
Home Values in the Area
Average Home Value in this Area
Purchase History
| Date | Buyer | Sale Price | Title Company |
|---|---|---|---|
| Lance William H | $425,000 | -- | |
| Russom Kevin M | -- | -- | |
| Willard Daniel Hansen | $264,900 | -- | |
| Federal National Mtg Associati | $482,240 | -- | |
| Suntrust Mtg Inc | $482,240 | -- |
Source: Public Records
Mortgage History
| Date | Status | Borrower | Loan Amount |
|---|---|---|---|
| Open | Lance William H | $382,500 | |
| Previous Owner | Willard Daniel Hansen | $256,950 |
Source: Public Records
Tax History Compared to Growth
Tax History
| Year | Tax Paid | Tax Assessment Tax Assessment Total Assessment is a certain percentage of the fair market value that is determined by local assessors to be the total taxable value of land and additions on the property. | Land | Improvement |
|---|---|---|---|---|
| 2025 | $16,422 | $215,760 | $56,000 | $159,760 |
| 2024 | $16,422 | $282,600 | $62,480 | $220,120 |
| 2023 | $3,767 | $308,800 | $62,480 | $246,320 |
| 2022 | $3,121 | $255,840 | $43,440 | $212,400 |
| 2021 | $11,179 | $189,560 | $32,600 | $156,960 |
| 2020 | $5,986 | $189,560 | $32,600 | $156,960 |
| 2019 | $8,422 | $189,560 | $32,600 | $156,960 |
| 2018 | $10,243 | $170,000 | $29,410 | $140,590 |
| 2017 | $4,948 | $168,720 | $32,600 | $136,120 |
| 2016 | $1,788 | $162,280 | $32,600 | $129,680 |
| 2015 | $3,598 | $67,320 | $0 | $67,320 |
| 2014 | $3,133 | $67,400 | $0 | $0 |
Source: Public Records
Map
Nearby Homes
- 9 W York St Unit 306
- 20 W Oglethorpe Ave Unit D
- 105 W Oglethorpe Ave Unit 307
- 105 W Oglethorpe Ave Unit 203
- 105 Whitaker St Unit 302
- 50 Barnard St Unit 304
- 2 E Perry Ln Unit s A, B and C
- 25 W Perry St
- 101 Barnard St Unit 203
- 210 E State St Unit 35
- 228 E Oglethorpe Ave
- 216 E State St Unit 3D (12)
- 24 E Liberty St Unit 73/83
- 24 E Liberty St Unit 53
- 24 E Liberty St Unit 36
- 24 E Liberty St Unit 42
- 117 Lincoln St Unit 4A
- 117 Lincoln St Unit 5A
- 300 Bull St Unit 704
- 300 Bull St Unit 404A
- 1 W York St Unit G
- 1 W York St Unit D, Savannah, GA
- 1 W York St Unit D
- 1 W York St Unit C
- 1 W York St Unit E & F
- 1 W York Unit A St
- 135 Bull St Unit 3
- 137 Bull St Unit 2
- 5 W York St Unit 2.6
- 141 Bull St
- 11 W York St Unit 201
- 11 W York St Unit 2.6
- 11 W York St Unit 206
- 0 W York St Unit 116222
- 13 W York St
- 9 W York St Unit 2.4
- 9 W York St
- 9 W York St Unit 3.3
- 9 W York St Unit 307
- 9 W York St Unit 304