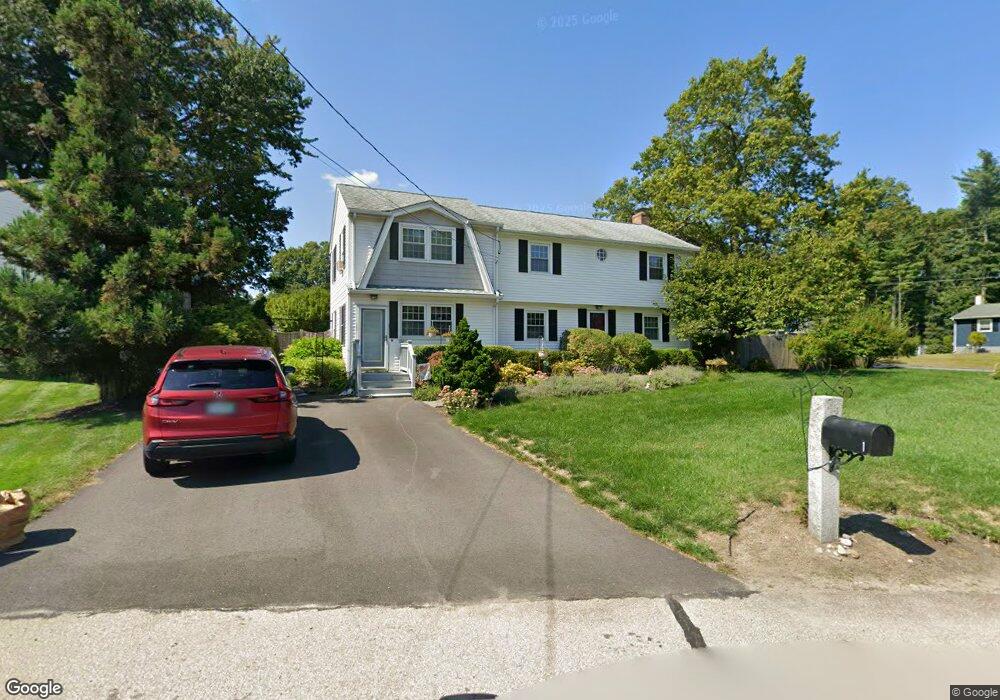
1 Wakefield Dr Nashua, NH 03062
Southwest Nashua NeighborhoodEstimated Value: $566,000 - $621,000
3
Beds
3
Baths
2,144
Sq Ft
$276/Sq Ft
Est. Value
About This Home
This home is located at 1 Wakefield Dr, Nashua, NH 03062 and is currently estimated at $592,762, approximately $276 per square foot. 1 Wakefield Dr is a home located in Hillsborough County with nearby schools including New Searles School, Fairgrounds Middle School, and Nashua High School South.
Ownership History
Date
Name
Owned For
Owner Type
Purchase Details
Closed on
Apr 27, 2024
Sold by
Mason Philip and Mason Cathi M
Bought by
Mason
Current Estimated Value
Purchase Details
Closed on
May 29, 1991
Bought by
Mason Philip and Mason Cathi M
Create a Home Valuation Report for This Property
The Home Valuation Report is an in-depth analysis detailing your home's value as well as a comparison with similar homes in the area
Home Values in the Area
Average Home Value in this Area
Purchase History
| Date | Buyer | Sale Price | Title Company |
|---|---|---|---|
| Mason | -- | None Available | |
| Mason | -- | None Available | |
| Mason Philip | $119,900 | -- |
Source: Public Records
Mortgage History
| Date | Status | Borrower | Loan Amount |
|---|---|---|---|
| Previous Owner | Mason Philip | $235,754 | |
| Previous Owner | Mason Philip | $97,845 | |
| Previous Owner | Mason Philip | $233,632 | |
| Previous Owner | Mason Philip | $68,400 |
Source: Public Records
Tax History Compared to Growth
Tax History
| Year | Tax Paid | Tax Assessment Tax Assessment Total Assessment is a certain percentage of the fair market value that is determined by local assessors to be the total taxable value of land and additions on the property. | Land | Improvement |
|---|---|---|---|---|
| 2024 | $8,314 | $522,900 | $162,700 | $360,200 |
| 2023 | $7,792 | $427,400 | $130,200 | $297,200 |
| 2022 | $7,723 | $427,400 | $130,200 | $297,200 |
| 2021 | $6,276 | $270,300 | $86,800 | $183,500 |
| 2020 | $6,111 | $270,300 | $86,800 | $183,500 |
| 2019 | $5,882 | $270,300 | $86,800 | $183,500 |
| 2018 | $5,733 | $270,300 | $86,800 | $183,500 |
| 2017 | $6,179 | $239,600 | $67,500 | $172,100 |
| 2016 | $6,007 | $239,600 | $67,500 | $172,100 |
| 2015 | $5,877 | $239,600 | $67,500 | $172,100 |
| 2014 | $5,762 | $239,600 | $67,500 | $172,100 |
Source: Public Records
Map
Nearby Homes
- 2 Wakefield Dr
- 23 Glen Dr
- 4 Henry David Dr Unit 203
- 11 Bordeaux St
- 30 Gingras Dr
- 5 Wilderness Dr
- 22 Kern Dr
- 15 Westray Dr
- 247 Main Dunstable Rd
- 9 Michelle Dr
- 5 Appaloosa Place
- 97 Linwood St
- 63 Dexter St
- 375 Main Dunstable Rd
- 30 Gendron St
- 8 Althea Ln Unit U26
- 41 New Dunstable Rd Unit 371
- 17 Herrick St
- 31 Tenby Dr
- 29 Dickens St
- 34 Nottingham Dr
- 3 Wakefield Dr
- 31 Nottingham Dr
- 29 Nottingham Dr
- 36 Nottingham Dr
- 4 Wakefield Dr
- 33 Nottingham Dr
- 35 Nottingham Dr
- 5 Wakefield Dr
- 6 Wakefield Dr
- 3 Stafford Rd
- 27 Nottingham Dr
- 37 Nottingham Dr
- 19 Glen Dr
- 38 Nottingham Dr
- 28 Pollard Rd
- 39 Nottingham Dr
- 4 Stafford Rd
- 17 Glen Dr
- 21 Glen Dr