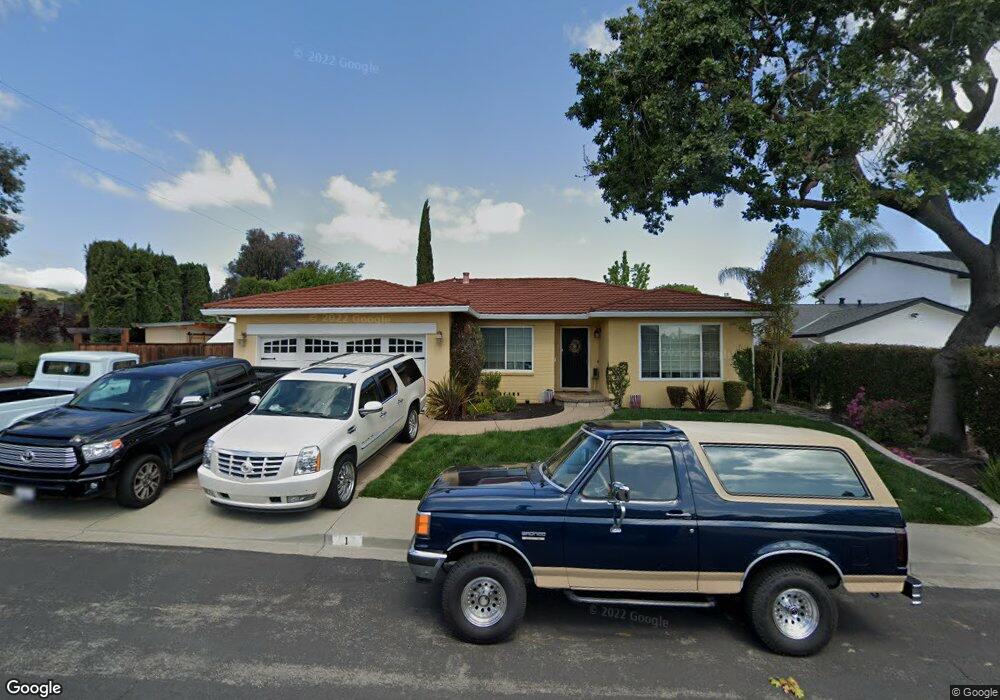
1 Waterbury Place San Ramon, CA 94583
San Ramon Valley NeighborhoodEstimated Value: $1,464,000 - $1,578,000
4
Beds
2
Baths
1,795
Sq Ft
$835/Sq Ft
Est. Value
About This Home
This home is located at 1 Waterbury Place, San Ramon, CA 94583 and is currently estimated at $1,498,904, approximately $835 per square foot. 1 Waterbury Place is a home located in Contra Costa County with nearby schools including Neil A. Armstrong Elementary School, Pine Valley Middle School, and California High School.
Ownership History
Date
Name
Owned For
Owner Type
Purchase Details
Closed on
Oct 16, 2002
Sold by
Guingao Jojo and Guingao Jardin
Bought by
Wright Justin and Wright Rhonda
Current Estimated Value
Home Financials for this Owner
Home Financials are based on the most recent Mortgage that was taken out on this home.
Original Mortgage
$409,600
Interest Rate
6.09%
Mortgage Type
Stand Alone First
Purchase Details
Closed on
Feb 22, 1999
Sold by
Andrews Bonnie J
Bought by
Guingao Jojo and Guingao Jardin
Home Financials for this Owner
Home Financials are based on the most recent Mortgage that was taken out on this home.
Original Mortgage
$252,000
Interest Rate
9.95%
Mortgage Type
Purchase Money Mortgage
Purchase Details
Closed on
May 29, 1998
Sold by
Andrews Bonnie J
Bought by
Andrews Bonnie J
Create a Home Valuation Report for This Property
The Home Valuation Report is an in-depth analysis detailing your home's value as well as a comparison with similar homes in the area
Home Values in the Area
Average Home Value in this Area
Purchase History
| Date | Buyer | Sale Price | Title Company |
|---|---|---|---|
| Wright Justin | $512,000 | Fidelity National Title | |
| Guingao Jojo | $280,000 | Chicago Title Co | |
| Andrews Bonnie J | -- | -- |
Source: Public Records
Mortgage History
| Date | Status | Borrower | Loan Amount |
|---|---|---|---|
| Previous Owner | Wright Justin | $409,600 | |
| Previous Owner | Guingao Jojo | $252,000 | |
| Closed | Wright Justin | $51,200 |
Source: Public Records
Tax History Compared to Growth
Tax History
| Year | Tax Paid | Tax Assessment Tax Assessment Total Assessment is a certain percentage of the fair market value that is determined by local assessors to be the total taxable value of land and additions on the property. | Land | Improvement |
|---|---|---|---|---|
| 2025 | $8,626 | $741,525 | $477,942 | $263,583 |
| 2024 | $8,485 | $726,986 | $468,571 | $258,415 |
| 2023 | $8,485 | $712,733 | $459,384 | $253,349 |
| 2022 | $8,422 | $698,759 | $450,377 | $248,382 |
| 2021 | $8,256 | $685,059 | $441,547 | $243,512 |
| 2019 | $8,087 | $664,742 | $428,451 | $236,291 |
| 2018 | $7,787 | $651,708 | $420,050 | $231,658 |
| 2017 | $7,506 | $638,930 | $411,814 | $227,116 |
| 2016 | $7,413 | $626,403 | $403,740 | $222,663 |
| 2015 | $7,341 | $616,995 | $397,676 | $219,319 |
| 2014 | $7,255 | $604,910 | $389,887 | $215,023 |
Source: Public Records
Map
Nearby Homes
- 740 Sutter Creek Ln Unit 740
- 10 Almond Orchard Ln
- 14 Poppy Hills Ln
- 25 Marilyn Place
- 4 Henry Ranch Dr
- 3163 Christopher Way
- 2740 Mohawk Cir
- 10013 Foxboro Cir
- 3217 Ensenada Dr
- 10034 Foxboro Cir
- 3104 Sombrero Cir
- 341 Santa Cruz Place
- 9832 Del Mar Dr
- 74 Hazelnut Ct
- 820 Pinehurst Place
- 754 Winterside Cir
- 434 Devon Ct
- 54 Madrid Place
- 6 San Pedro Place
- 115 Reflections Dr Unit 26
- 5 Waterbury Place
- 20 Winslow Place
- 28 Winslow Place
- 2 Waterbury Place
- 9 Waterbury Place
- 24 Winslow Place
- 6 Waterbury Place
- 14 Waterbury Place
- 10 Waterbury Place
- 2801 Bridgeport Ave
- 21 Winslow Place
- 32 Winslow Place
- 25 Winslow Place
- 2809 Bridgeport Ave
- 9803 Davona Dr
- 9801 Davona Dr
- 9805 Davona Dr
- 2817 Bridgeport Ave
- 29 Winslow Place
- 9799 Davona Dr