1 Withe Pass Burlington, CT 06013
Estimated Value: $705,461 - $866,000
4
Beds
3
Baths
3,073
Sq Ft
$252/Sq Ft
Est. Value
About This Home
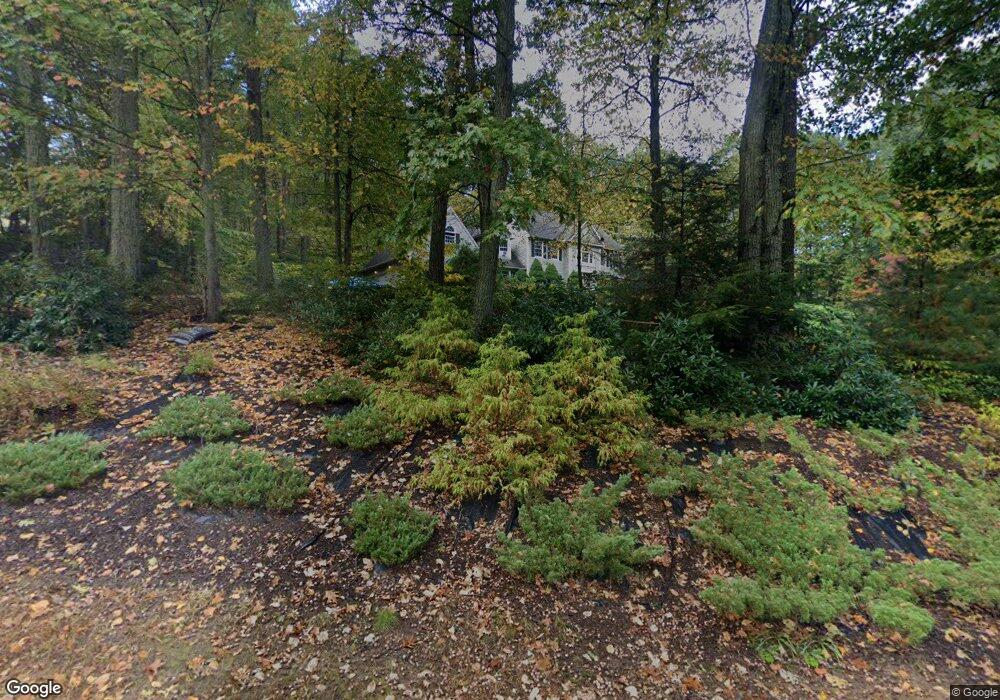
This home is located at 1 Withe Pass, Burlington, CT 06013 and is currently estimated at $774,615, approximately $252 per square foot. 1 Withe Pass is a home located in Hartford County with nearby schools including Lake Garda Elementary School, Har-Bur Middle School, and Lewis S. Mills High School.
Ownership History
Date
Name
Owned For
Owner Type
Purchase Details
Closed on
Jan 5, 2023
Sold by
Francis Janice A
Bought by
Francis Paul B
Current Estimated Value
Home Financials for this Owner
Home Financials are based on the most recent Mortgage that was taken out on this home.
Original Mortgage
$436,000
Interest Rate
6%
Mortgage Type
Adjustable Rate Mortgage/ARM
Purchase Details
Closed on
May 2, 2011
Sold by
Beddingfield Timothy
Bought by
Francis Paul B and Francis Janice A
Home Financials for this Owner
Home Financials are based on the most recent Mortgage that was taken out on this home.
Original Mortgage
$359,500
Interest Rate
4.76%
Purchase Details
Closed on
Feb 1, 2000
Sold by
Suchoski Paul G and Suchoski Sharon T
Bought by
Beddingfield Timothy and Beddingfield Barbara
Purchase Details
Closed on
May 28, 1996
Sold by
Carr-Brett Ellen and Carr Stephen
Bought by
Oconnor Paul and Oconnor Edina
Purchase Details
Closed on
Jan 22, 1996
Sold by
Heller Reed R
Bought by
Suchoski Paul G and Suchoski Sharon T
Create a Home Valuation Report for This Property
The Home Valuation Report is an in-depth analysis detailing your home's value as well as a comparison with similar homes in the area
Home Values in the Area
Average Home Value in this Area
Purchase History
| Date | Buyer | Sale Price | Title Company |
|---|---|---|---|
| Francis Paul B | -- | None Available | |
| Francis Paul B | -- | None Available | |
| Francis Paul B | $487,500 | -- | |
| Beddingfield Timothy | $349,850 | -- | |
| Oconnor Paul | $115,000 | -- | |
| Suchoski Paul G | $332,500 | -- | |
| Francis Paul B | $487,500 | -- | |
| Beddingfield Timothy | $349,850 | -- | |
| Oconnor Paul | $115,000 | -- | |
| Suchoski Paul G | $332,500 | -- |
Source: Public Records
Mortgage History
| Date | Status | Borrower | Loan Amount |
|---|---|---|---|
| Previous Owner | Francis Paul B | $436,000 | |
| Previous Owner | Suchoski Paul G | $360,500 | |
| Previous Owner | Suchoski Paul G | $359,500 |
Source: Public Records
Tax History
| Year | Tax Paid | Tax Assessment Tax Assessment Total Assessment is a certain percentage of the fair market value that is determined by local assessors to be the total taxable value of land and additions on the property. | Land | Improvement |
|---|---|---|---|---|
| 2025 | $10,191 | $383,110 | $96,040 | $287,070 |
| 2024 | $9,923 | $383,110 | $96,040 | $287,070 |
| 2023 | $9,453 | $293,580 | $106,400 | $187,180 |
| 2022 | $9,600 | $293,580 | $106,400 | $187,180 |
| 2021 | $9,806 | $293,580 | $106,400 | $187,180 |
| 2020 | $9,776 | $293,580 | $106,400 | $187,180 |
| 2019 | $9,688 | $293,580 | $106,400 | $187,180 |
| 2018 | $9,698 | $298,410 | $106,400 | $192,010 |
| 2017 | $9,549 | $298,410 | $106,400 | $192,010 |
| 2016 | $9,430 | $298,410 | $106,400 | $192,010 |
| 2015 | $9,281 | $298,410 | $106,400 | $192,010 |
| 2014 | $8,908 | $298,410 | $106,400 | $192,010 |
Source: Public Records
Map
Nearby Homes
- 114 Daniel Trace
- 36 Barnes Hill Rd
- 0 Spielman Hwy
- 9 Alice Dr
- 25 Punch Brook Rd
- 26 Berkshire Crossing
- 28 Sepous Rd
- 25 Fenwick Dr
- Lots 1-3 Verville Rd
- 64 Bridge St
- 5 W Woods Rd
- 51 Westland Rd
- 58 Weatherstone
- 2 Ventres Way
- 61 Weatherstone
- 48 Weatherstone
- 94 Lofgren Rd
- 138 Northington Dr
- 110 Windsor Ct
- 39 High Ridge Hollow
- 52 Hunters Crossing
- 60 Hunters Crossing
- 3 Withe Pass
- 2 Withe Pass
- 79 Hunters Crossing
- 75 Hunters Crossing
- 48 Hunters Crossing
- 64 Hunters Crossing
- 85 Hunters Crossing
- 5 Withe Pass
- 6 Withe Pass
- 71 Hunters Crossing
- 44 Hunters Crossing
- 67 Hunters Crossing
- 10 Withe Pass
- 9 Withe Pass
- 89 Hunters Crossing
- 81 Barnes Hill Rd
- 63 Hunters Crossing
- 42 Hunters Crossing
Your Personal Tour Guide
Ask me questions while you tour the home.