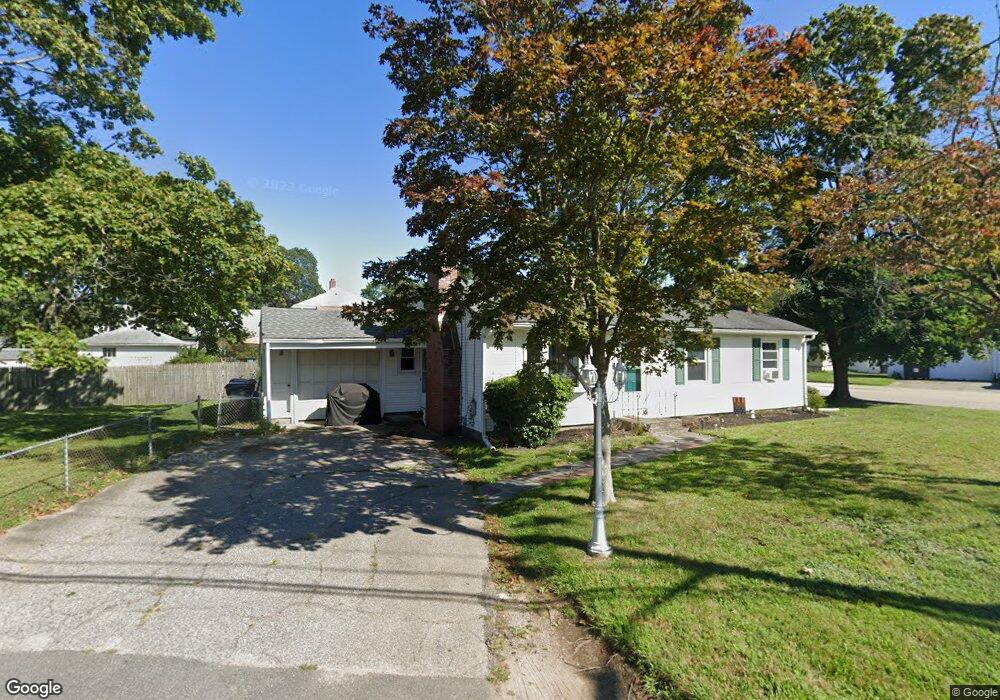
1 Woodbine St Riverside, RI 02915
Riverside NeighborhoodEstimated Value: $412,229 - $463,000
3
Beds
2
Baths
960
Sq Ft
$455/Sq Ft
Est. Value
About This Home
This home is located at 1 Woodbine St, Riverside, RI 02915 and is currently estimated at $437,057, approximately $455 per square foot. 1 Woodbine St is a home located in Providence County with nearby schools including East Providence High School, St Luke Elementary School, and St Mary Academy-Bay View.
Ownership History
Date
Name
Owned For
Owner Type
Purchase Details
Closed on
Oct 13, 2009
Sold by
Bennell Hope M K
Bought by
Totten Tiffany
Current Estimated Value
Home Financials for this Owner
Home Financials are based on the most recent Mortgage that was taken out on this home.
Original Mortgage
$142,373
Outstanding Balance
$92,875
Interest Rate
5.14%
Mortgage Type
Purchase Money Mortgage
Estimated Equity
$344,182
Create a Home Valuation Report for This Property
The Home Valuation Report is an in-depth analysis detailing your home's value as well as a comparison with similar homes in the area
Home Values in the Area
Average Home Value in this Area
Purchase History
| Date | Buyer | Sale Price | Title Company |
|---|---|---|---|
| Totten Tiffany | $145,000 | -- |
Source: Public Records
Mortgage History
| Date | Status | Borrower | Loan Amount |
|---|---|---|---|
| Open | Totten Tiffany | $25,000 | |
| Open | Totten Tiffany | $142,373 |
Source: Public Records
Tax History
| Year | Tax Paid | Tax Assessment Tax Assessment Total Assessment is a certain percentage of the fair market value that is determined by local assessors to be the total taxable value of land and additions on the property. | Land | Improvement |
|---|---|---|---|---|
| 2025 | $4,931 | $377,300 | $139,000 | $238,300 |
| 2024 | $4,933 | $321,800 | $115,800 | $206,000 |
| 2023 | $4,750 | $321,800 | $115,800 | $206,000 |
| 2022 | $4,265 | $195,100 | $59,000 | $136,100 |
| 2021 | $4,195 | $195,100 | $59,000 | $136,100 |
| 2020 | $4,017 | $195,100 | $59,000 | $136,100 |
| 2019 | $3,906 | $195,100 | $59,000 | $136,100 |
| 2018 | $3,826 | $167,200 | $57,400 | $109,800 |
| 2017 | $3,740 | $167,200 | $57,400 | $109,800 |
| 2016 | $3,722 | $167,200 | $57,400 | $109,800 |
| 2015 | $3,594 | $156,600 | $53,200 | $103,400 |
| 2014 | $3,594 | $156,600 | $53,200 | $103,400 |
Source: Public Records
Map
Nearby Homes
- 25 Winslow St
- 14 Benedict St
- 14 Winthrop St
- 103 Burnside Ave
- 151 Willett Ave Unit 2
- 33 Pine St Unit 35
- 85 Hilton Ave
- 15 Plaza Dr
- 15 Claire St
- 28 Jefferson Ave
- 10 Booth Ave
- 72 Stowe Ave
- 23 Albert Ave
- 43 Bullocks Point Ave Unit 4A
- 41 White Ave
- 25 Bullocks Point Ave Unit 5C
- 33 Bullocks Point Ave Unit 5C
- 6 Fuller Ave
- 6 Hazelton Rd
- 129 Shore Rd
Your Personal Tour Guide
Ask me questions while you tour the home.