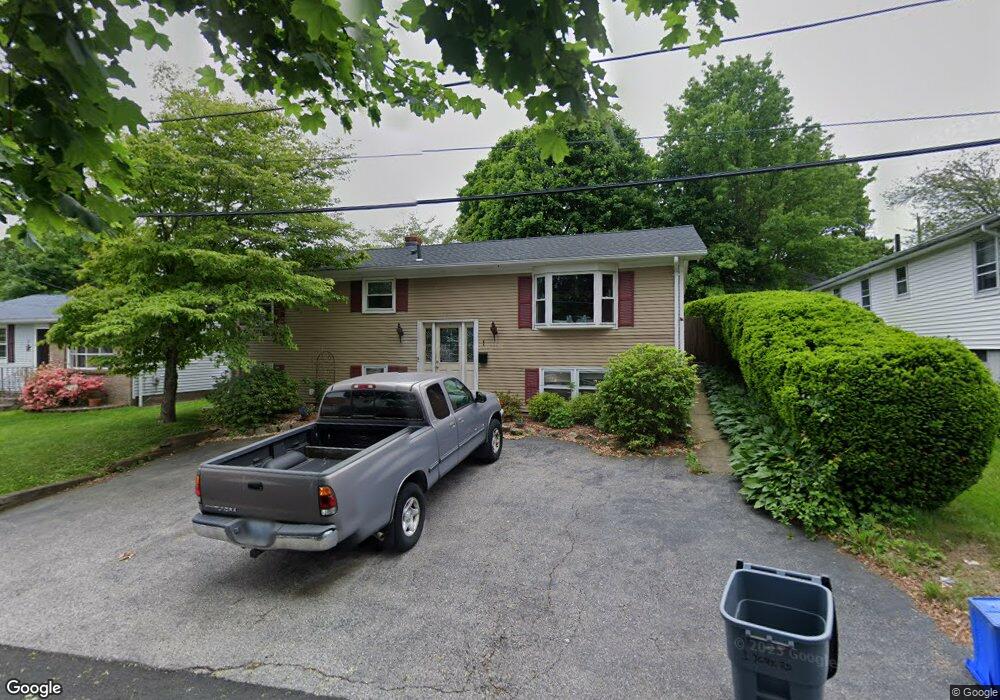
1 York Rd Johnston, RI 02919
Killingly Street NeighborhoodEstimated Value: $398,000 - $439,000
3
Beds
2
Baths
1,996
Sq Ft
$212/Sq Ft
Est. Value
About This Home
This home is located at 1 York Rd, Johnston, RI 02919 and is currently estimated at $423,038, approximately $211 per square foot. 1 York Rd is a home located in Providence County with nearby schools including Johnston Senior High School, Achievement First Promesa, and Achievement First Providence Mayoral Academy Elementary School.
Ownership History
Date
Name
Owned For
Owner Type
Purchase Details
Closed on
Sep 30, 2010
Sold by
Wells Fargo Bk
Bought by
Venneman Todd and Beaurars Christa
Current Estimated Value
Home Financials for this Owner
Home Financials are based on the most recent Mortgage that was taken out on this home.
Original Mortgage
$108,500
Outstanding Balance
$70,516
Interest Rate
4.44%
Mortgage Type
Purchase Money Mortgage
Estimated Equity
$352,522
Purchase Details
Closed on
Apr 20, 2010
Sold by
Mather Shawn K
Bought by
Wells Fargo Bk
Purchase Details
Closed on
Aug 31, 2001
Sold by
Distefano Andrew and Distefano Antonia
Bought by
Mather Shawn K
Create a Home Valuation Report for This Property
The Home Valuation Report is an in-depth analysis detailing your home's value as well as a comparison with similar homes in the area
Home Values in the Area
Average Home Value in this Area
Purchase History
| Date | Buyer | Sale Price | Title Company |
|---|---|---|---|
| Venneman Todd | $138,500 | -- | |
| Wells Fargo Bk | $151,672 | -- | |
| Mather Shawn K | $112,000 | -- | |
| Venneman Todd | $138,500 | -- | |
| Wells Fargo Bk | $151,672 | -- | |
| Mather Shawn K | $112,000 | -- |
Source: Public Records
Mortgage History
| Date | Status | Borrower | Loan Amount |
|---|---|---|---|
| Closed | Mather Shawn K | $31,750 | |
| Open | Mather Shawn K | $108,500 |
Source: Public Records
Tax History
| Year | Tax Paid | Tax Assessment Tax Assessment Total Assessment is a certain percentage of the fair market value that is determined by local assessors to be the total taxable value of land and additions on the property. | Land | Improvement |
|---|---|---|---|---|
| 2025 | $4,998 | $320,000 | $83,100 | $236,900 |
| 2024 | $4,896 | $320,000 | $83,100 | $236,900 |
| 2023 | $4,896 | $320,000 | $83,100 | $236,900 |
| 2022 | $4,667 | $200,800 | $63,900 | $136,900 |
| 2021 | $4,667 | $200,800 | $63,900 | $136,900 |
| 2018 | $4,794 | $174,400 | $50,200 | $124,200 |
| 2016 | $6,343 | $174,400 | $50,200 | $124,200 |
| 2015 | $4,705 | $162,300 | $52,500 | $109,800 |
| 2014 | $4,666 | $162,300 | $52,500 | $109,800 |
| 2013 | $4,666 | $162,300 | $52,500 | $109,800 |
Source: Public Records
Map
Nearby Homes
- 0 Orchard St Unit 1396400
- 0 Orchard St Unit 1400488
- 10 Mott St
- 0 Central Ave Unit 1406483
- 60 Ophelia St
- 102 Ophelia St
- 56 N Olney St
- 6 Harrington Dr
- 15 Melissa St
- 129 Glenbridge Ave
- 165 Borden Ave
- 162 Merino St
- 231 Lowell Ave
- 665 Plainfield St
- 166 Lowell Ave
- 615 Killingly St
- 29 Matson Ave Unit 35
- 240 Eastwood Ave
- 0 Ipswich St
- 6 Stockwell St
Your Personal Tour Guide
Ask me questions while you tour the home.