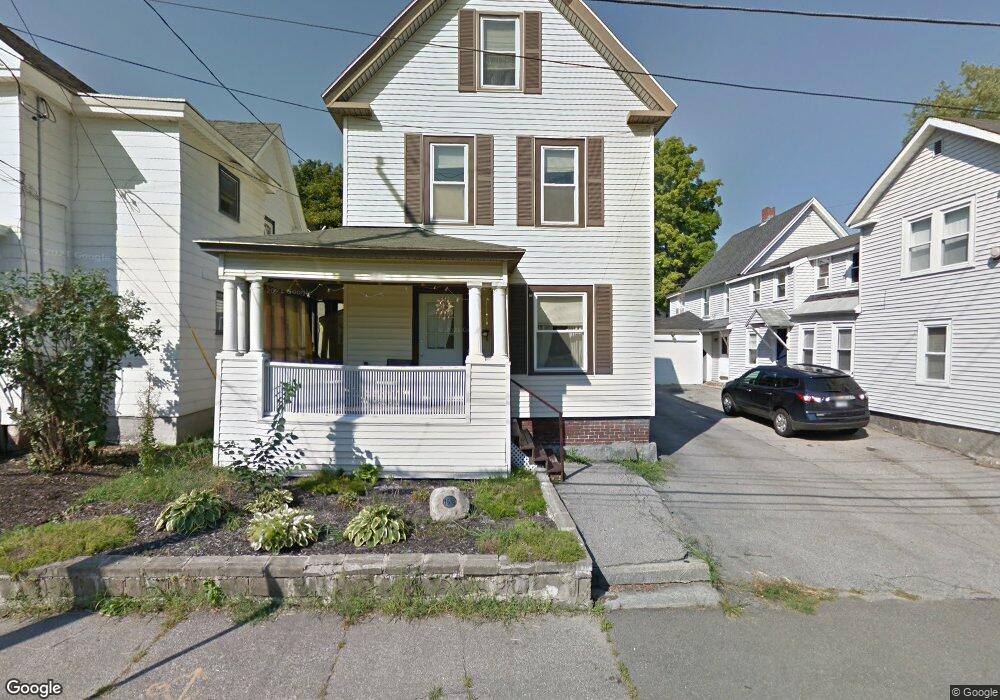
10 1/2 S Spring St Concord, NH 03301
South End NeighborhoodEstimated Value: $428,536 - $473,000
3
Beds
2
Baths
2,052
Sq Ft
$218/Sq Ft
Est. Value
About This Home
This home is located at 10 1/2 S Spring St, Concord, NH 03301 and is currently estimated at $448,134, approximately $218 per square foot. 10 1/2 S Spring St is a home located in Merrimack County with nearby schools including Christa McAuliffe School, Rundlett Middle School, and Concord High School.
Ownership History
Date
Name
Owned For
Owner Type
Purchase Details
Closed on
Nov 22, 2024
Sold by
Heath Summer L and Heath Tanner G
Bought by
Fraser Mary and Fraser Brendan
Current Estimated Value
Home Financials for this Owner
Home Financials are based on the most recent Mortgage that was taken out on this home.
Original Mortgage
$265,000
Outstanding Balance
$262,460
Interest Rate
6.32%
Mortgage Type
Purchase Money Mortgage
Estimated Equity
$185,674
Purchase Details
Closed on
Sep 28, 2016
Sold by
Jain Jitender K and Jain Neelam K
Bought by
Olson Summer L
Home Financials for this Owner
Home Financials are based on the most recent Mortgage that was taken out on this home.
Original Mortgage
$196,278
Interest Rate
3.12%
Mortgage Type
FHA
Create a Home Valuation Report for This Property
The Home Valuation Report is an in-depth analysis detailing your home's value as well as a comparison with similar homes in the area
Home Values in the Area
Average Home Value in this Area
Purchase History
| Date | Buyer | Sale Price | Title Company |
|---|---|---|---|
| Fraser Mary | $415,000 | None Available | |
| Olson Summer L | $199,933 | -- | |
| Olson Summer L | $199,933 | -- |
Source: Public Records
Mortgage History
| Date | Status | Borrower | Loan Amount |
|---|---|---|---|
| Open | Fraser Mary | $265,000 | |
| Previous Owner | Olson Summer L | $196,278 |
Source: Public Records
Tax History Compared to Growth
Tax History
| Year | Tax Paid | Tax Assessment Tax Assessment Total Assessment is a certain percentage of the fair market value that is determined by local assessors to be the total taxable value of land and additions on the property. | Land | Improvement |
|---|---|---|---|---|
| 2024 | $7,786 | $281,200 | $88,400 | $192,800 |
| 2023 | $7,553 | $281,200 | $88,400 | $192,800 |
| 2022 | $7,280 | $281,200 | $88,400 | $192,800 |
| 2021 | $7,064 | $281,200 | $88,400 | $192,800 |
| 2020 | $6,390 | $238,800 | $70,600 | $168,200 |
| 2019 | $5,914 | $212,900 | $65,700 | $147,200 |
| 2018 | $5,844 | $207,300 | $65,700 | $141,600 |
| 2017 | $5,560 | $196,900 | $65,700 | $131,200 |
| 2016 | $5,299 | $191,500 | $65,700 | $125,800 |
| 2015 | $4,147 | $151,700 | $64,400 | $87,300 |
| 2014 | $4,067 | $151,700 | $64,400 | $87,300 |
| 2013 | -- | $142,600 | $64,400 | $78,200 |
| 2012 | $3,156 | $129,500 | $64,400 | $65,100 |
Source: Public Records
Map
Nearby Homes
- 26 South St
- 47 South St
- 4 Fayette St
- 24 Pierce St
- 10 Perley St
- 0 Spruce St Unit 88
- 33 Spruce St
- 122 South St
- 11 Washington St
- 2 Kensington Rd
- 30 Jackson St
- 1 Kensington Rd
- 105 S Main St
- 0 South St Unit 4969509
- 157 Rumford St
- 5 Broad Ave
- 19 Grappone Dr
- 27 Pinewood Trail
- 8-10 Granite Ave
- 20 Prospect St